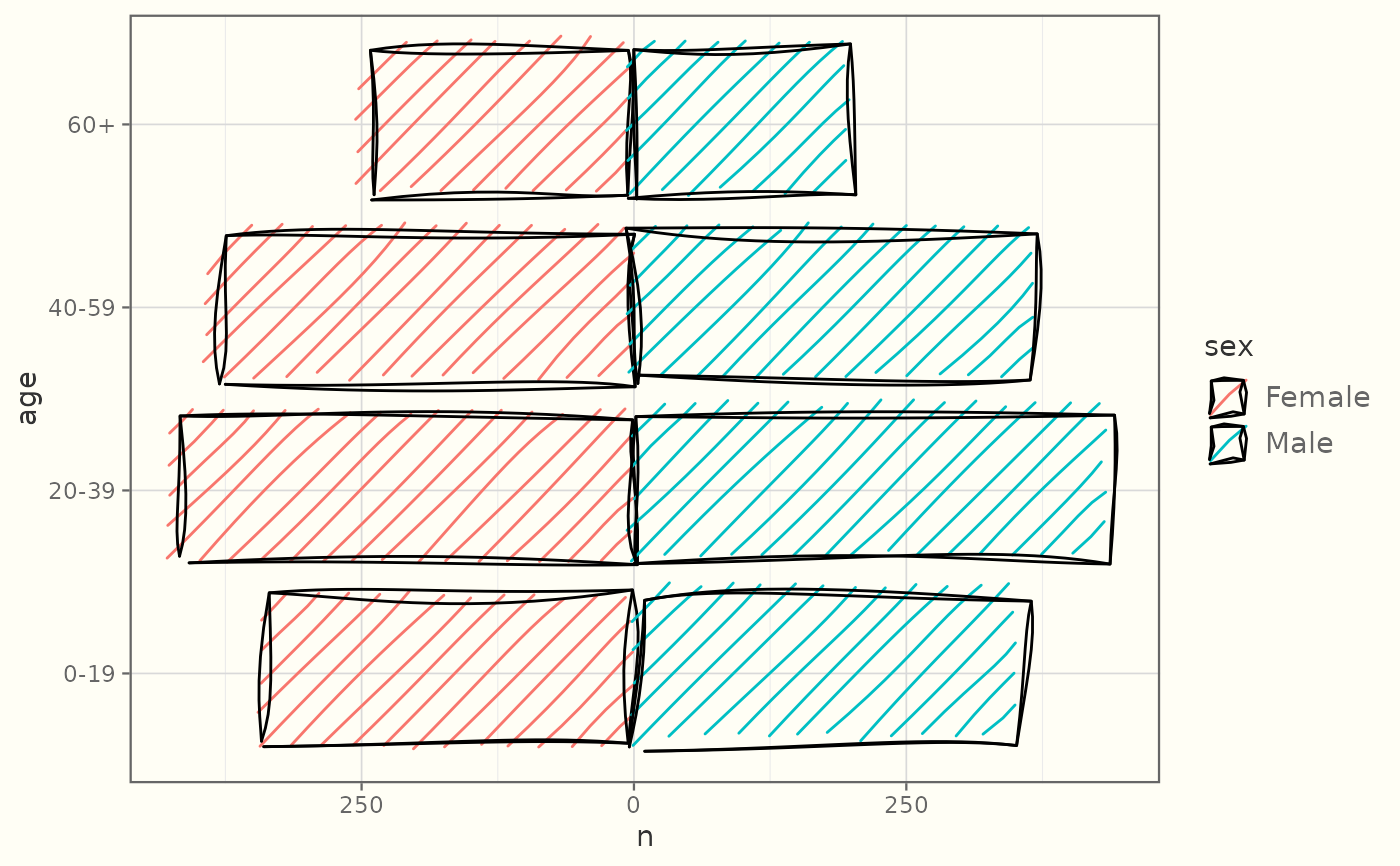
Draws a hand-drawn population pyramid: back-to-back horizontal bars per
category (y), mirrored about zero by a two-level side aesthetic (the
first level in sort order grows left, the second right). Usually you also
map fill to the same variable as side; relabel the mirrored axis with
scale_x_continuous(labels = abs).
Usage
StatSketchPyramid

GeomSketchPyramid

geom_sketch_pyramid(
  mapping = NULL,
  data = NULL,
  stat = "sketch_pyramid",
  position = "identity",
  ...,
  bar_width = 0.8,
  fill_style = "hachure",
  roughness = 1,
  bowing = 1,
  n_passes = 2L,
  seed = NULL,
  na.rm = FALSE,
  show.legend = NA,
  inherit.aes = TRUE
)
Arguments
- mapping
Aesthetic mappings created by
ggplot2::aes(). Requiresx(the count),y(the category) andside(the two-level split).- data
Data to display.
- stat
Statistical transformation. Default
"sketch_pyramid".- position
Position adjustment. Default
"identity".- ...
Other arguments passed on to the layer.
- bar_width
Bar thickness in y units. Default 0.8.
- fill_style
Bar fill style; see
geom_sketch_rect(). Default"hachure".- roughness, bowing, n_passes, seed
Sketch parameters.
- na.rm
Remove missing values silently? Default
FALSE.- show.legend
Logical; include in legend?
- inherit.aes
Override default aesthetics?
See also
Other sketch-geoms:
GeomSketchAbline,
GeomSketchArrow,
GeomSketchBoxplot,
GeomSketchBracket,
GeomSketchCallout,
GeomSketchChicklet,
GeomSketchCol,
GeomSketchContourFilled,
GeomSketchCurve,
GeomSketchDotplot,
GeomSketchDumbbell,
GeomSketchEdge,
GeomSketchEllipse,
GeomSketchEngrave,
GeomSketchGantt,
GeomSketchHex,
GeomSketchLine,
GeomSketchLinerange,
GeomSketchLollipop,
GeomSketchMarkCircle,
GeomSketchMarkHull,
GeomSketchPath,
GeomSketchPoint,
GeomSketchPolygon,
GeomSketchRect,
GeomSketchRibbon,
GeomSketchRug,
GeomSketchSegment,
GeomSketchSfPolygon,
GeomSketchSlope,
GeomSketchSmooth,
GeomSketchSpoke,
GeomSketchTextRepel,
GeomSketchViolin,
StatSketchBeeswarm,
StatSketchCalendar,
StatSketchDensityRidges,
StatSketchFunnel,
StatSketchPie,
StatSketchRadar,
StatSketchStream,
StatSketchTreemap,
StatSketchWaffle,
StatSketchWaterfall,
annotate_sketch(),
annotate_sketch_arrow(),
annotate_sketch_callout(),
annotate_sketch_highlight(),
geom_sketch_alluvial(),
geom_sketch_arc_diagram(),
geom_sketch_bin2d(),
geom_sketch_bump(),
geom_sketch_chord(),
geom_sketch_contour(),
geom_sketch_count(),
geom_sketch_dendrogram(),
geom_sketch_density(),
geom_sketch_density2d(),
geom_sketch_ecdf(),
geom_sketch_function(),
geom_sketch_histogram(),
geom_sketch_jitter(),
geom_sketch_marimekko(),
geom_sketch_mosaic(),
geom_sketch_parallel(),
geom_sketch_qq(),
geom_sketch_quantile(),
geom_sketch_rose(),
geom_sketch_sunburst(),
geom_sketch_text(),
sketch_graph()
Examples
library(ggplot2)
pop <- data.frame(
  age = factor(rep(c("0-19", "20-39", "40-59", "60+"), 2),
               levels = c("0-19", "20-39", "40-59", "60+")),
  sex = rep(c("Female", "Male"), each = 4),
  n   = c(340, 420, 380, 240, 360, 440, 370, 200)
)
ggplot(pop, aes(n, age, side = sex, fill = sex)) +
  geom_sketch_pyramid(seed = 1L) +
  scale_x_continuous(labels = abs) +
  theme_sketch()