Highlighter swipes and hand-drawn underlines
Source:R/annotate-sketch.R
annotate_sketch_highlight.RdTwo one-off emphasis annotations (constant positions,
inherit.aes = FALSE):
Usage
annotate_sketch_highlight(
  x,
  y,
  xend,
  yend,
  colour = "#f7e017",
  linewidth = 8,
  seed = NULL,
  ...
)

annotate_sketch_underline(
  x,
  y,
  xend,
  colour = "grey15",
  linewidth = 0.7,
  strokes = 1L,
  roughness = 1.6,
  bowing = 0.4,
  seed = NULL,
  ...
)
Arguments
- x, y, xend, yend
Endpoint positions in data units (vectors recycle).
annotate_sketch_underline()is horizontal:yenddefaults toy.- colour
Ink colour. Highlight defaults to fluorescent yellow.
- linewidth
Stroke width. The highlighter medium multiplies it into a wide band; the underline stays a line.
- seed
Integer seed for reproducible wobble.
- ...
Other arguments passed to
geom_sketch_segment().- strokes
Number of overlapped underline strokes. Default 1.
- roughness
Wobble amount. Underlines default a little shakier.
- bowing
Bow of the underline stroke (kept low so repeated strokes stay together). Default 0.4.
Details
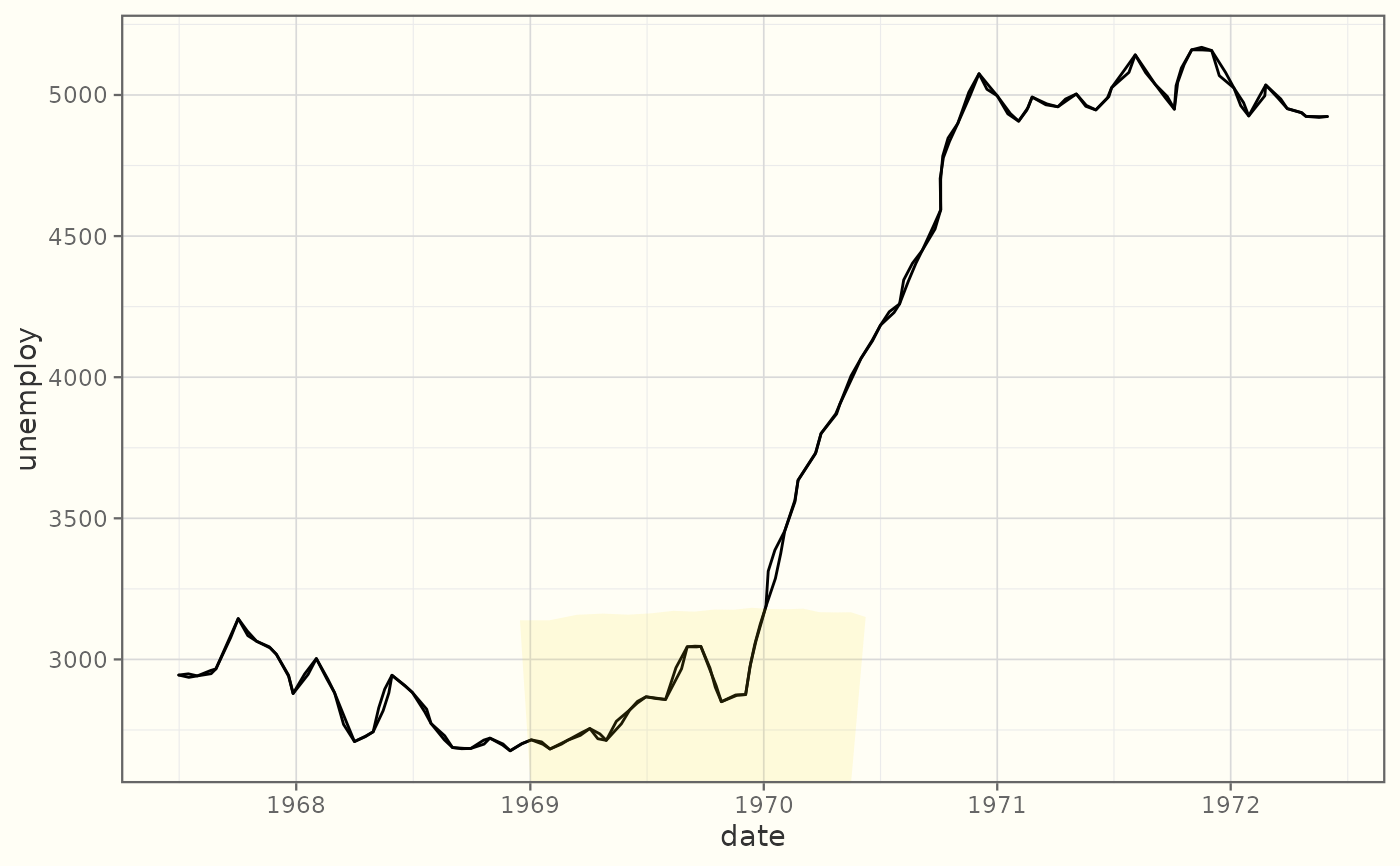
annotate_sketch_highlight()lays a wide, translucent chisel-tip band (the"highlighter"medium) from(x, y)to(xend, yend)– swipe it over a line, a label or a region of interest like a fluorescent marker.annotate_sketch_underline()draws a quick wobbly stroke from(x, y)to(xend, y)– an underline for a data point or a piece of text.strokes > 1re-draws it with fresh wobble for an emphatic scrawl.
See also
Other sketch-geoms:
GeomSketchAbline,
GeomSketchArrow,
GeomSketchBoxplot,
GeomSketchBracket,
GeomSketchCallout,
GeomSketchChicklet,
GeomSketchCol,
GeomSketchContourFilled,
GeomSketchCurve,
GeomSketchDotplot,
GeomSketchDumbbell,
GeomSketchEdge,
GeomSketchEllipse,
GeomSketchEngrave,
GeomSketchGantt,
GeomSketchHex,
GeomSketchLine,
GeomSketchLinerange,
GeomSketchLollipop,
GeomSketchMarkCircle,
GeomSketchMarkHull,
GeomSketchPath,
GeomSketchPoint,
GeomSketchPolygon,
GeomSketchRect,
GeomSketchRibbon,
GeomSketchRug,
GeomSketchSegment,
GeomSketchSfPolygon,
GeomSketchSlope,
GeomSketchSmooth,
GeomSketchSpoke,
GeomSketchTextRepel,
GeomSketchViolin,
StatSketchBeeswarm,
StatSketchCalendar,
StatSketchDensityRidges,
StatSketchFunnel,
StatSketchPie,
StatSketchPyramid,
StatSketchRadar,
StatSketchStream,
StatSketchTreemap,
StatSketchWaffle,
StatSketchWaterfall,
annotate_sketch(),
annotate_sketch_arrow(),
annotate_sketch_callout(),
geom_sketch_alluvial(),
geom_sketch_arc_diagram(),
geom_sketch_bin2d(),
geom_sketch_bump(),
geom_sketch_chord(),
geom_sketch_contour(),
geom_sketch_count(),
geom_sketch_dendrogram(),
geom_sketch_density(),
geom_sketch_density2d(),
geom_sketch_ecdf(),
geom_sketch_function(),
geom_sketch_histogram(),
geom_sketch_jitter(),
geom_sketch_marimekko(),
geom_sketch_mosaic(),
geom_sketch_parallel(),
geom_sketch_qq(),
geom_sketch_quantile(),
geom_sketch_rose(),
geom_sketch_sunburst(),
geom_sketch_text(),
sketch_graph()
Examples
library(ggplot2)
ggplot(economics[1:60, ], aes(date, unemploy)) +
  geom_sketch_line(seed = 1L) +
  annotate_sketch_highlight(
    x = as.Date("1969-01-01"), y = 2800,
    xend = as.Date("1970-06-01"), yend = 2800
  ) +
  theme_sketch()