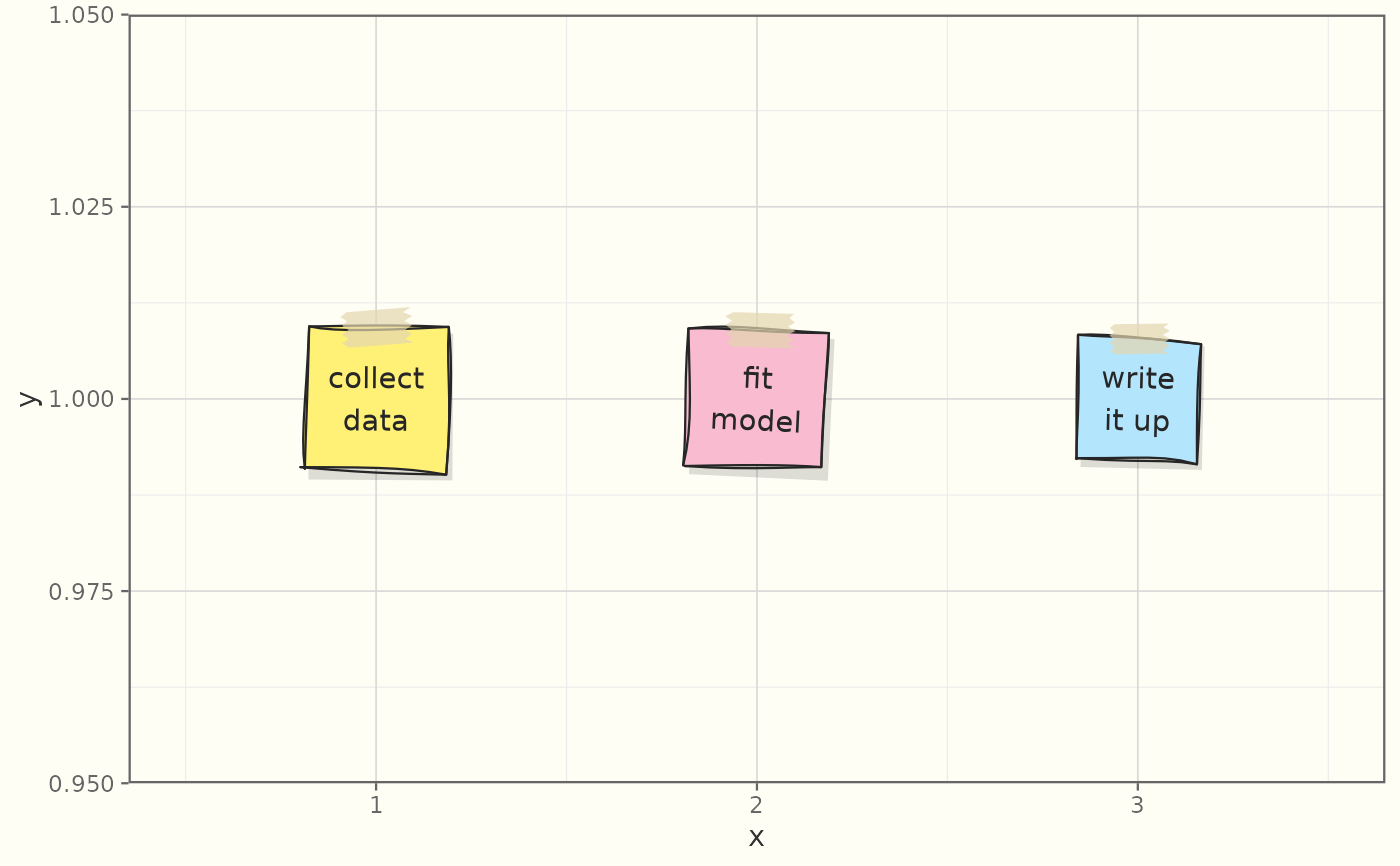
Draws each label in handwriting on a sticky note: a square of paper,
tilted a little, with a roughened outline, a faint shadow and a strip of
translucent tape with torn ends across its top. The note sizes itself to the
label (at least 0.6 inches a side); break long labels with "\n".
Usage
GeomSketchNote

geom_sketch_note(
  mapping = NULL,
  data = NULL,
  stat = "identity",
  position = "identity",
  ...,
  roughness = 0.6,
  bowing = 0.5,
  n_passes = 2L,
  seed = NULL,
  width = NULL,
  height = NULL,
  padding = 0.12,
  shadow = TRUE,
  tape = c("top", "corners", "none"),
  tape_fill = "#E3D6AF",
  tape_alpha = 0.7,
  family = NULL,
  na.rm = FALSE,
  show.legend = FALSE,
  inherit.aes = TRUE
)
Arguments
- mapping
Aesthetic mappings created by
ggplot2::aes(). Requiresx,yandlabel.- data
Data with one row per note.
- stat
Statistical transformation. Default
"identity".- position
Position adjustment. Default
"identity".- ...
Other arguments passed on to the layer.
- roughness
Non-negative roughness of the outline (0 = clean). Default 0.6.
- bowing
Non-negative bowing multiplier. Default 0.5.
- n_passes
Number of outline passes. Default 2.
- seed
Integer seed.
NULLusesgetOption("ggsketch.seed", 1L).- width, height
Note size in inches.
NULL(the default) fits a square to each label; givewidthalone for square notes of that side.- padding
Space between the label and the note's edge, in inches. Default 0.12.
- shadow
Draw a faint shadow under each note? Default
TRUE.- tape
Tape:
"top"(a strip across the top edge, the default),"corners"(a strip across each top corner) or"none".- tape_fill, tape_alpha
The tape's colour and opacity. Default a masking-tape beige at 0.7.
- family
Font family for the labels. Defaults to the same family as
theme_sketch()(getOption("ggsketch.base_family", ""), i.e. the device default), so the labels match the plot's other text; setoptions(ggsketch.base_family = "auto")for a handwriting face, or pass an explicit family here.- na.rm
Remove missing values silently? Default
FALSE.- show.legend
Logical; include in legend? Default
FALSE.- inherit.aes
Inherit aesthetics from the plot? Default
TRUE.
Details
For one-off notes, annotate_sketch_note() is the easiest entry point.
Aesthetics
geom_sketch_note() understands x, y and label (required), plus
colour (the ink of the label and outline, default a near-black that does
not follow the theme's ink), fill (the paper, default sticky-note yellow),
alpha, linewidth (the outline), size (the label's font size, in mm as
for ggplot2::geom_text()) and angle (the tilt in degrees; the default
NA tilts each note by a seeded random amount within 4 degrees either way).
See also
Other sketch-geoms:
GeomSketchAbline,
GeomSketchArrow,
GeomSketchBoxplot,
GeomSketchBracket,
GeomSketchCallout,
GeomSketchChicklet,
GeomSketchCol,
GeomSketchContourFilled,
GeomSketchCurve,
GeomSketchDotplot,
GeomSketchDumbbell,
GeomSketchEdge,
GeomSketchEllipse,
GeomSketchEngrave,
GeomSketchGantt,
GeomSketchHex,
GeomSketchLine,
GeomSketchLinerange,
GeomSketchLollipop,
GeomSketchMarkCircle,
GeomSketchMarkHull,
GeomSketchPath,
GeomSketchPoint,
GeomSketchPolygon,
GeomSketchRect,
GeomSketchRibbon,
GeomSketchRug,
GeomSketchSegment,
GeomSketchSfPolygon,
GeomSketchSlope,
GeomSketchSmooth,
GeomSketchSpoke,
GeomSketchTextRepel,
GeomSketchViolin,
StatSketchBeeswarm,
StatSketchCalendar,
StatSketchDensityRidges,
StatSketchFunnel,
StatSketchPie,
StatSketchPyramid,
StatSketchRadar,
StatSketchStream,
StatSketchTreemap,
StatSketchWaffle,
StatSketchWaterfall,
annotate_sketch(),
annotate_sketch_arrow(),
annotate_sketch_callout(),
annotate_sketch_highlight(),
annotate_sketch_note(),
geom_sketch_alluvial(),
geom_sketch_arc_diagram(),
geom_sketch_bin2d(),
geom_sketch_bump(),
geom_sketch_chord(),
geom_sketch_contour(),
geom_sketch_count(),
geom_sketch_dendrogram(),
geom_sketch_density(),
geom_sketch_density2d(),
geom_sketch_ecdf(),
geom_sketch_function(),
geom_sketch_histogram(),
geom_sketch_jitter(),
geom_sketch_marimekko(),
geom_sketch_mosaic(),
geom_sketch_parallel(),
geom_sketch_point_interactive(),
geom_sketch_qq(),
geom_sketch_quantile(),
geom_sketch_rose(),
geom_sketch_sunburst(),
geom_sketch_text(),
sketch_graph()
Examples
library(ggplot2)
todo <- data.frame(
  x = c(1, 2, 3), y = 1,
  label = c("collect\ndata", "fit\nmodel", "write\nit up")
)
ggplot(todo, aes(x, y, label = label)) +
  geom_sketch_note(fill = c("#FFF176", "#F8BBD0", "#B3E5FC"), seed = 3L) +
  xlim(0.5, 3.5) +
  theme_sketch()