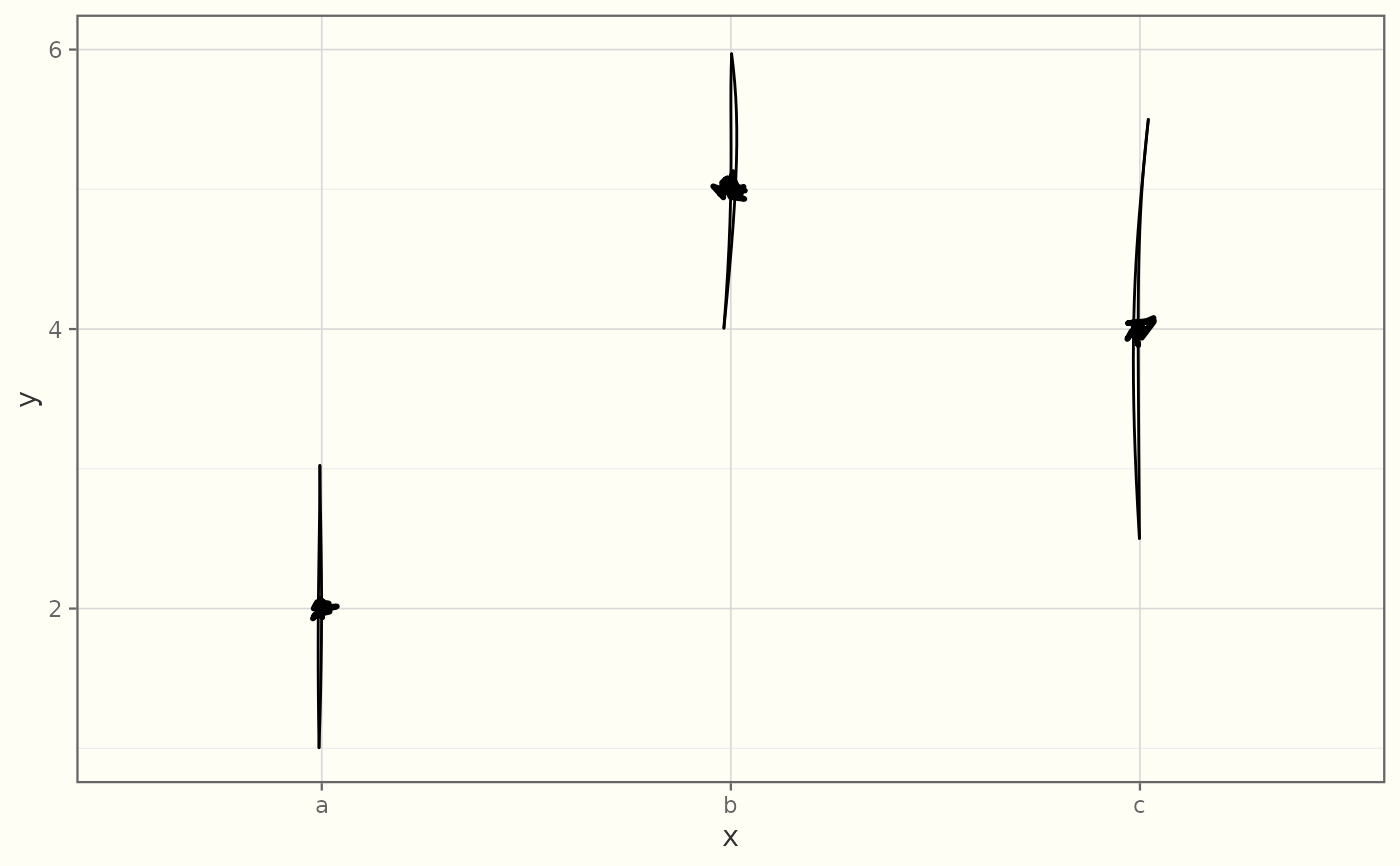
Hand-drawn uncertainty intervals at each x: geom_sketch_linerange() draws
a vertical range from ymin to ymax; geom_sketch_pointrange() adds a point
at y; geom_sketch_errorbar() adds end caps; geom_sketch_crossbar() draws
a rough box with a line at y. Sketch analogues of
ggplot2::geom_linerange() and friends. Vertical orientation only in this
release.
Usage
GeomSketchLinerange

GeomSketchPointrange

GeomSketchErrorbar

GeomSketchCrossbar

geom_sketch_linerange(
  mapping = NULL,
  data = NULL,
  stat = "identity",
  position = "identity",
  ...,
  roughness = 0.7,
  bowing = 1,
  n_passes = 2L,
  seed = NULL,
  na.rm = FALSE,
  show.legend = NA,
  inherit.aes = TRUE
)

geom_sketch_pointrange(
  mapping = NULL,
  data = NULL,
  stat = "identity",
  position = "identity",
  ...,
  fatten = 4,
  roughness = 0.7,
  bowing = 1,
  n_passes = 2L,
  seed = NULL,
  na.rm = FALSE,
  show.legend = NA,
  inherit.aes = TRUE
)

geom_sketch_errorbar(
  mapping = NULL,
  data = NULL,
  stat = "identity",
  position = "identity",
  ...,
  width = 0.5,
  roughness = 0.7,
  bowing = 1,
  n_passes = 2L,
  seed = NULL,
  na.rm = FALSE,
  show.legend = NA,
  inherit.aes = TRUE
)

geom_sketch_crossbar(
  mapping = NULL,
  data = NULL,
  stat = "identity",
  position = "identity",
  ...,
  width = 0.5,
  roughness = 0.7,
  bowing = 1,
  n_passes = 2L,
  seed = NULL,
  fill_style = "solid",
  hachure_angle = 45,
  hachure_gap = NULL,
  fill_weight = 0.5,
  na.rm = FALSE,
  show.legend = NA,
  inherit.aes = TRUE
)
Format
An object of class GeomSketchLinerange (inherits from Geom, ggproto, gg) of length 6.
An object of class GeomSketchPointrange (inherits from Geom, ggproto, gg) of length 6.
An object of class GeomSketchErrorbar (inherits from Geom, ggproto, gg) of length 7.
An object of class GeomSketchCrossbar (inherits from Geom, ggproto, gg) of length 7.
Arguments
- mapping, data, stat, position, na.rm, show.legend, inherit.aes, ...
Standard layer arguments.
- roughness, bowing, n_passes, seed
Sketch parameters.
- fatten
For
pointrange, multiply the pointsizeby this factor.- width
For
errorbar/crossbar, the cap/box width in data units.- fill_style, hachure_angle, hachure_gap, fill_weight
Fill parameters for the
crossbarbox.
See also
Other sketch-geoms:
GeomSketchAbline,
GeomSketchBoxplot,
GeomSketchBracket,
GeomSketchCol,
GeomSketchCurve,
GeomSketchEllipse,
GeomSketchHex,
GeomSketchLine,
GeomSketchPath,
GeomSketchPoint,
GeomSketchPolygon,
GeomSketchRect,
GeomSketchRibbon,
GeomSketchRug,
GeomSketchSegment,
GeomSketchSmooth,
GeomSketchSpoke,
GeomSketchViolin,
annotate_sketch(),
geom_sketch_bin2d(),
geom_sketch_contour(),
geom_sketch_count(),
geom_sketch_density(),
geom_sketch_density2d(),
geom_sketch_function(),
geom_sketch_histogram(),
geom_sketch_jitter(),
geom_sketch_qq(),
geom_sketch_quantile(),
geom_sketch_text()