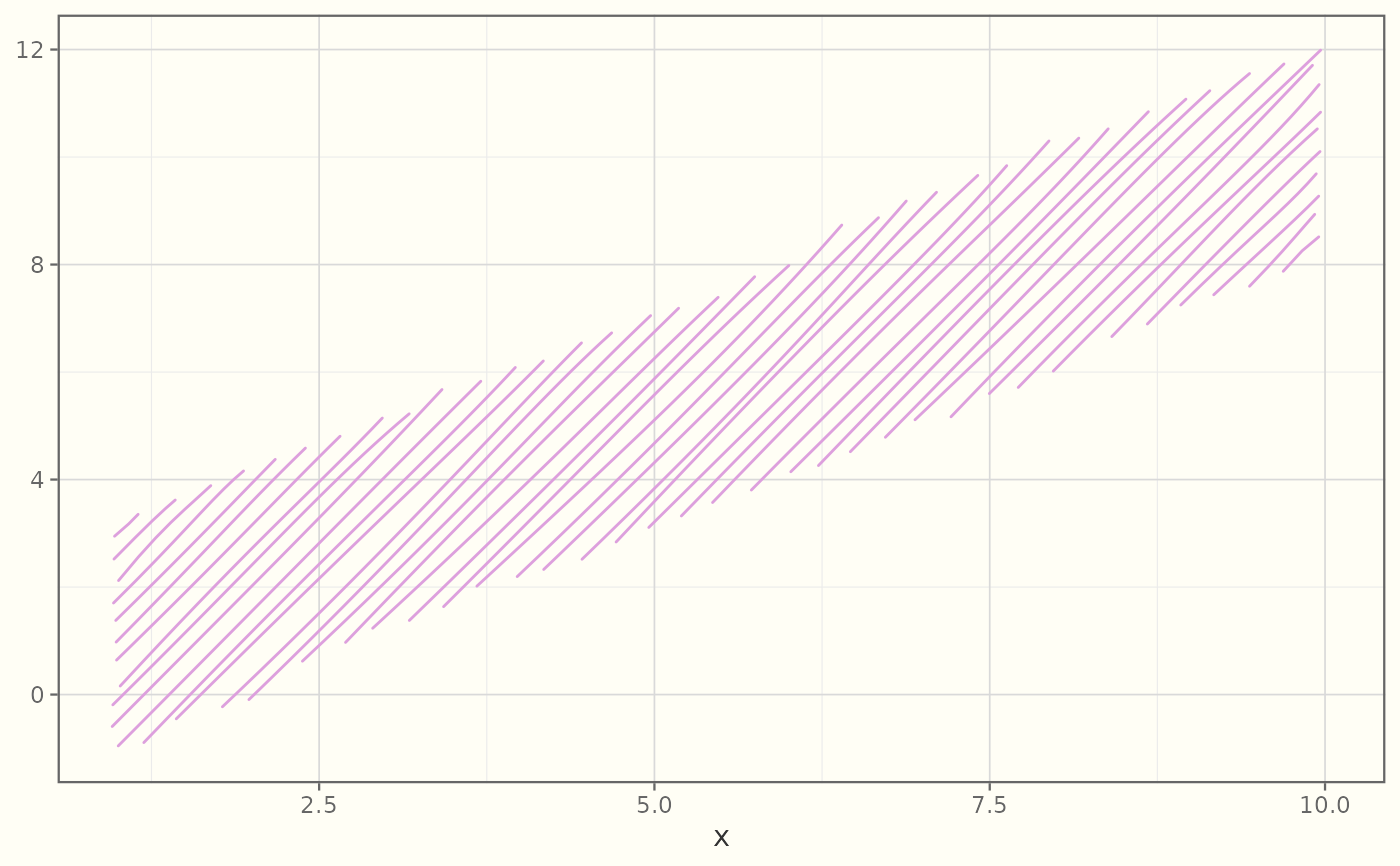
geom_sketch_ribbon() draws a hand-drawn band between ymin and ymax.
geom_sketch_area() is the special case anchored at zero (ymin = 0,
ymax = y). Both use a roughened outline and a hachure-style fill, the
sketch analogues of ggplot2::geom_ribbon() / ggplot2::geom_area().
Usage
GeomSketchRibbon

geom_sketch_ribbon(
  mapping = NULL,
  data = NULL,
  stat = "identity",
  position = "identity",
  ...,
  roughness = 1,
  bowing = 1,
  n_passes = 2L,
  seed = NULL,
  fill_style = "hachure",
  hachure_angle = 45,
  hachure_gap = NULL,
  fill_weight = 0.5,
  na.rm = FALSE,
  show.legend = NA,
  inherit.aes = TRUE
)

GeomSketchArea

geom_sketch_area(
  mapping = NULL,
  data = NULL,
  stat = "identity",
  position = "identity",
  ...,
  roughness = 1,
  bowing = 1,
  n_passes = 2L,
  seed = NULL,
  fill_style = "hachure",
  hachure_angle = 45,
  hachure_gap = NULL,
  fill_weight = 0.5,
  na.rm = FALSE,
  show.legend = NA,
  inherit.aes = TRUE
)
Format
An object of class GeomSketchRibbon (inherits from Geom, ggproto, gg) of length 6.
An object of class GeomSketchArea (inherits from GeomSketchRibbon, Geom, ggproto, gg) of length 4.
Arguments
- mapping
Set of aesthetic mappings created by
ggplot2::aes().- data
Data to display.
- stat
Statistical transformation. Default
"identity".- position
Position adjustment. Default
"identity".- ...
Other arguments passed on to the layer.
- roughness
Non-negative roughness (0 = straight). Default 1.
- bowing
Non-negative bowing multiplier. Default 1.
- n_passes
Number of stroke passes. Default 2.
- seed
Integer seed.
NULLusesgetOption("ggsketch.seed", 1L).- fill_style
One of
"hachure","cross_hatch","zigzag","zigzag_line","scribble","dots","dashed", or"solid". Default"hachure".- hachure_angle
Fill line angle in degrees. Default 45.
- hachure_gap
Fill line gap in npc units (
NULL= 6% of diagonal).- fill_weight
Stroke weight for fill lines. Default 0.5.
- na.rm
Remove missing values silently? Default
FALSE.- show.legend
Logical; include in legend?
- inherit.aes
Override default aesthetics?
See also
Other sketch-geoms:
GeomSketchAbline,
GeomSketchBoxplot,
GeomSketchBracket,
GeomSketchCol,
GeomSketchCurve,
GeomSketchEllipse,
GeomSketchHex,
GeomSketchLine,
GeomSketchLinerange,
GeomSketchPath,
GeomSketchPoint,
GeomSketchPolygon,
GeomSketchRect,
GeomSketchRug,
GeomSketchSegment,
GeomSketchSmooth,
GeomSketchSpoke,
GeomSketchViolin,
annotate_sketch(),
geom_sketch_bin2d(),
geom_sketch_contour(),
geom_sketch_count(),
geom_sketch_density(),
geom_sketch_density2d(),
geom_sketch_function(),
geom_sketch_histogram(),
geom_sketch_jitter(),
geom_sketch_qq(),
geom_sketch_quantile(),
geom_sketch_text()
Examples
library(ggplot2)
df <- data.frame(x = 1:10, lo = (1:10) - 2, hi = (1:10) + 2)
ggplot(df, aes(x)) +
  geom_sketch_ribbon(aes(ymin = lo, ymax = hi), fill = "plum", seed = 1L) +
  theme_sketch()