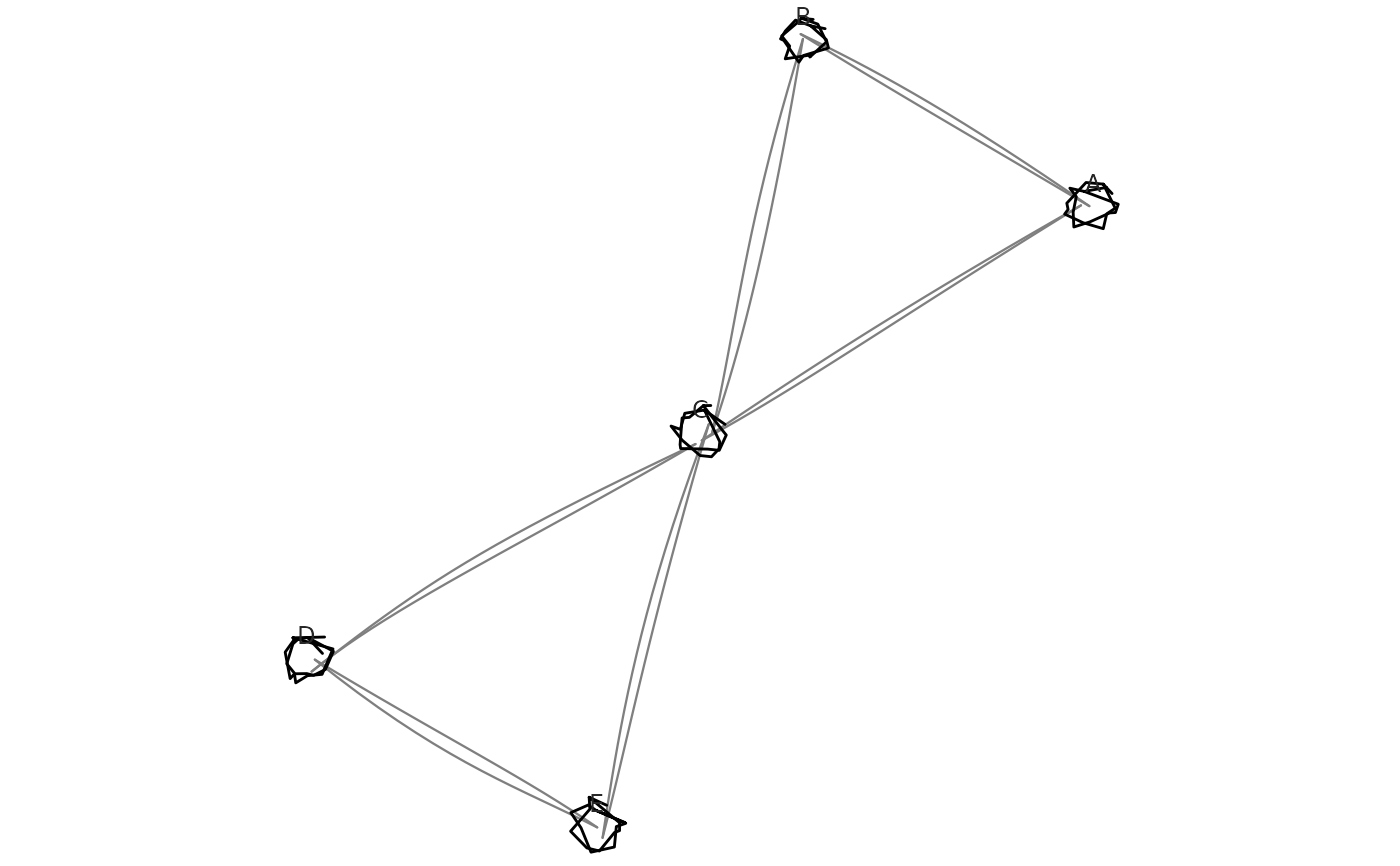
A hand-drawn take on network/graph plotting. geom_sketch_edge() draws a
roughened connector between (x, y) and (xend, yend); geom_sketch_node()
draws roughened node markers with optional handwriting labels. Pair them
with sketch_graph(), which computes node positions with a pure-R
force-directed layout (force_layout()) and returns the two data frames
these geoms expect - no graph package required.
Usage
GeomSketchEdge

geom_sketch_edge(
  mapping = NULL,
  data = NULL,
  stat = "identity",
  position = "identity",
  ...,
  curvature = 0,
  roughness = 1,
  bowing = 1,
  n_passes = 2L,
  seed = NULL,
  na.rm = FALSE,
  show.legend = NA,
  inherit.aes = TRUE
)

GeomSketchNode

geom_sketch_node(
  mapping = NULL,
  data = NULL,
  stat = "identity",
  position = "identity",
  ...,
  roughness = NULL,
  bowing = NULL,
  n_passes = 2L,
  seed = NULL,
  label_size = 3.2,
  label_colour = "grey15",
  label_family = NULL,
  na.rm = FALSE,
  show.legend = NA,
  inherit.aes = TRUE
)
Arguments
- mapping
Aesthetic mappings created by
ggplot2::aes().- data
Data to display. For
geom_sketch_edge()the rows needx/y/xend/yend; forgeom_sketch_node()they needx/y(and an optionallabel). Typically the$edgesand$nodesfromsketch_graph().- stat, position
Statistical transformation and position adjustment. Default
"identity"for both.- ...
Other arguments passed on to the layer.
- curvature
Edge bend.
0(default) draws straight roughened edges; non-zero gives arc edges (a quadratic Bezier), likegeom_sketch_curve().- roughness, bowing, n_passes, seed
Sketch parameters; see
geom_sketch_path(). Forgeom_sketch_node(),roughnessis a mappable aesthetic (per node).- na.rm
Remove missing values silently? Default
FALSE.- show.legend, inherit.aes
Standard layer arguments.
- label_size
Handwriting label size (mm). Default 3.2.
- label_colour
Label colour. Default
"grey15".- label_family
Label font family. Defaults to the first installed handwriting face (as
geom_sketch_text()uses).
See also
sketch_graph(), force_layout().
Other sketch-geoms:
GeomSketchAbline,
GeomSketchArrow,
GeomSketchBoxplot,
GeomSketchBracket,
GeomSketchCallout,
GeomSketchChicklet,
GeomSketchCol,
GeomSketchContourFilled,
GeomSketchCurve,
GeomSketchDotplot,
GeomSketchDumbbell,
GeomSketchEllipse,
GeomSketchEngrave,
GeomSketchGantt,
GeomSketchHex,
GeomSketchLine,
GeomSketchLinerange,
GeomSketchLollipop,
GeomSketchMarkCircle,
GeomSketchMarkHull,
GeomSketchPath,
GeomSketchPoint,
GeomSketchPolygon,
GeomSketchRect,
GeomSketchRibbon,
GeomSketchRug,
GeomSketchSegment,
GeomSketchSfPolygon,
GeomSketchSlope,
GeomSketchSmooth,
GeomSketchSpoke,
GeomSketchTextRepel,
GeomSketchViolin,
StatSketchBeeswarm,
StatSketchCalendar,
StatSketchDensityRidges,
StatSketchFunnel,
StatSketchPie,
StatSketchPyramid,
StatSketchRadar,
StatSketchStream,
StatSketchTreemap,
StatSketchWaffle,
StatSketchWaterfall,
annotate_sketch(),
annotate_sketch_arrow(),
annotate_sketch_callout(),
annotate_sketch_highlight(),
geom_sketch_alluvial(),
geom_sketch_arc_diagram(),
geom_sketch_bin2d(),
geom_sketch_bump(),
geom_sketch_chord(),
geom_sketch_contour(),
geom_sketch_count(),
geom_sketch_dendrogram(),
geom_sketch_density(),
geom_sketch_density2d(),
geom_sketch_ecdf(),
geom_sketch_function(),
geom_sketch_histogram(),
geom_sketch_jitter(),
geom_sketch_marimekko(),
geom_sketch_mosaic(),
geom_sketch_parallel(),
geom_sketch_qq(),
geom_sketch_quantile(),
geom_sketch_rose(),
geom_sketch_sunburst(),
geom_sketch_text(),
sketch_graph()
Examples
library(ggplot2)
edges <- data.frame(
  from = c("A", "A", "B", "C", "C", "D"),
  to   = c("B", "C", "C", "D", "E", "E")
)
g <- sketch_graph(edges, seed = 1L)
ggplot() +
  geom_sketch_edge(data = g$edges,
                   aes(x = x, y = y, xend = xend, yend = yend), seed = 1L) +
  geom_sketch_node(data = g$nodes,
                   aes(x = x, y = y, label = name), size = 6, seed = 2L) +
  coord_equal() +
  theme_void()