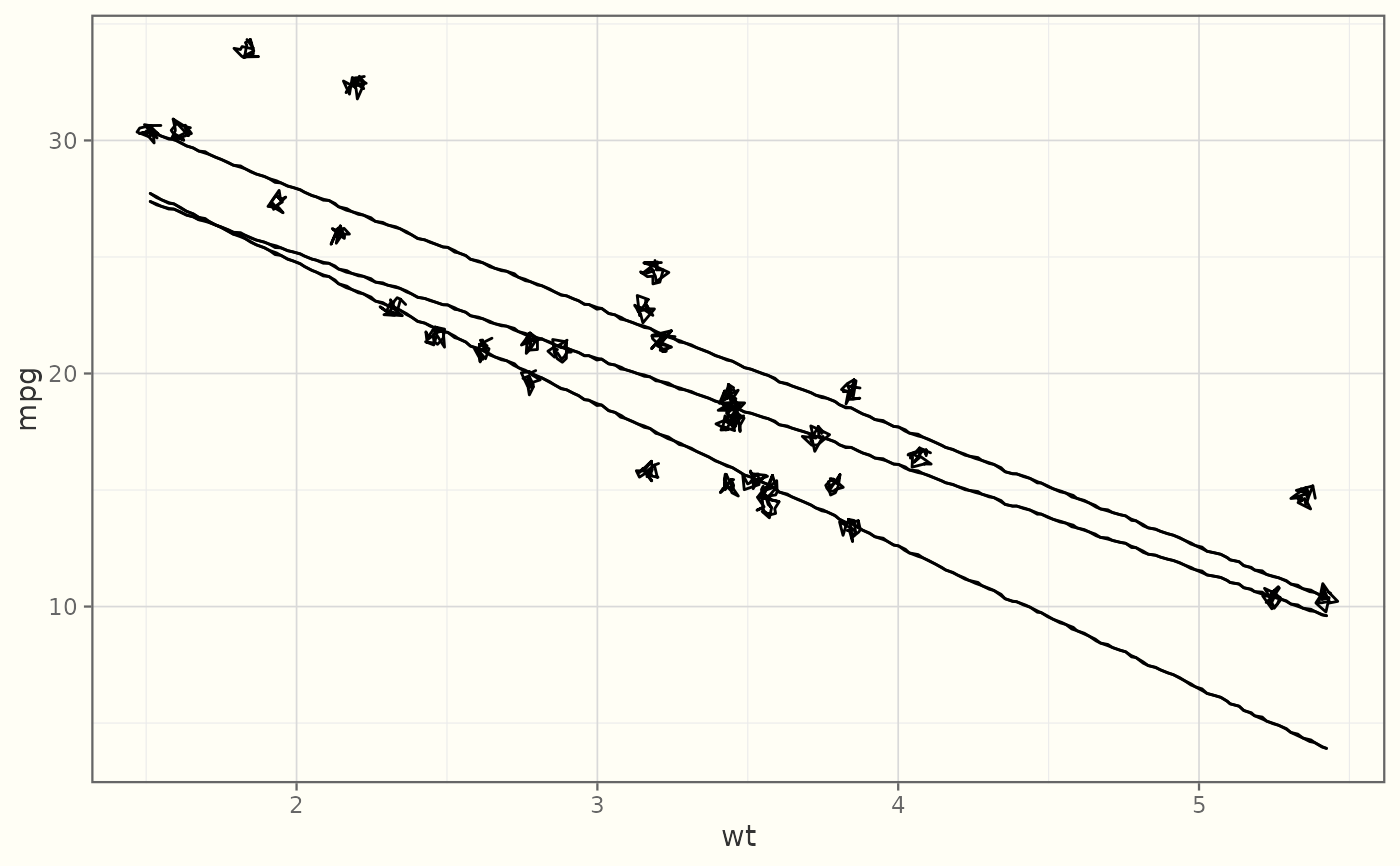
Fits and draws quantile regression lines with a hand-drawn stroke — the
sketch analogue of ggplot2::geom_quantile() / ggplot2::stat_quantile().
Requires the optional quantreg package.
Usage
geom_sketch_quantile(
  mapping = NULL,
  data = NULL,
  stat = "quantile",
  position = "identity",
  ...,
  quantiles = c(0.25, 0.5, 0.75),
  formula = NULL,
  method = "rq",
  roughness = 0.7,
  bowing = 0.5,
  n_passes = 2L,
  seed = NULL,
  na.rm = FALSE,
  show.legend = NA,
  inherit.aes = TRUE
)
Arguments
- mapping
Set of aesthetic mappings created by
ggplot2::aes().- data
Data to display.
- stat
Statistical transformation (default
"identity").- position
Position adjustment (default
"identity").- ...
Other arguments passed on to the layer.
- quantiles
Numeric vector of quantiles to fit. Default
c(0.25, 0.5, 0.75).- formula
Model formula passed to
quantreg::rq(). Defaulty ~ x.- method
Fitting method passed to
ggplot2::stat_quantile(). Default"rq".- roughness
Non-negative roughness parameter (0 = straight). Default 1.
- bowing
Non-negative bowing multiplier. Default 1.
- n_passes
Number of stroke passes for the double-stroke effect. Default 2.
- seed
Integer seed for reproducibility.
NULLusesgetOption("ggsketch.seed", 1L).- na.rm
If
FALSE(default), missing values are removed with a warning.- show.legend
Logical. Should this layer be included in the legend?
- inherit.aes
If
FALSE, override the default aesthetics.
See also
Other sketch-geoms:
GeomSketchAbline,
GeomSketchBoxplot,
GeomSketchBracket,
GeomSketchCol,
GeomSketchCurve,
GeomSketchEllipse,
GeomSketchHex,
GeomSketchLine,
GeomSketchLinerange,
GeomSketchPath,
GeomSketchPoint,
GeomSketchPolygon,
GeomSketchRect,
GeomSketchRibbon,
GeomSketchRug,
GeomSketchSegment,
GeomSketchSmooth,
GeomSketchSpoke,
GeomSketchViolin,
annotate_sketch(),
geom_sketch_bin2d(),
geom_sketch_contour(),
geom_sketch_count(),
geom_sketch_density(),
geom_sketch_density2d(),
geom_sketch_function(),
geom_sketch_histogram(),
geom_sketch_jitter(),
geom_sketch_qq(),
geom_sketch_text()
Examples
library(ggplot2)
if (requireNamespace("quantreg", quietly = TRUE)) {
  ggplot(mtcars, aes(wt, mpg)) +
    geom_sketch_point(seed = 1L) +
    geom_sketch_quantile(seed = 2L) +
    theme_sketch()
}
#> Smoothing formula not specified. Using: y ~ x