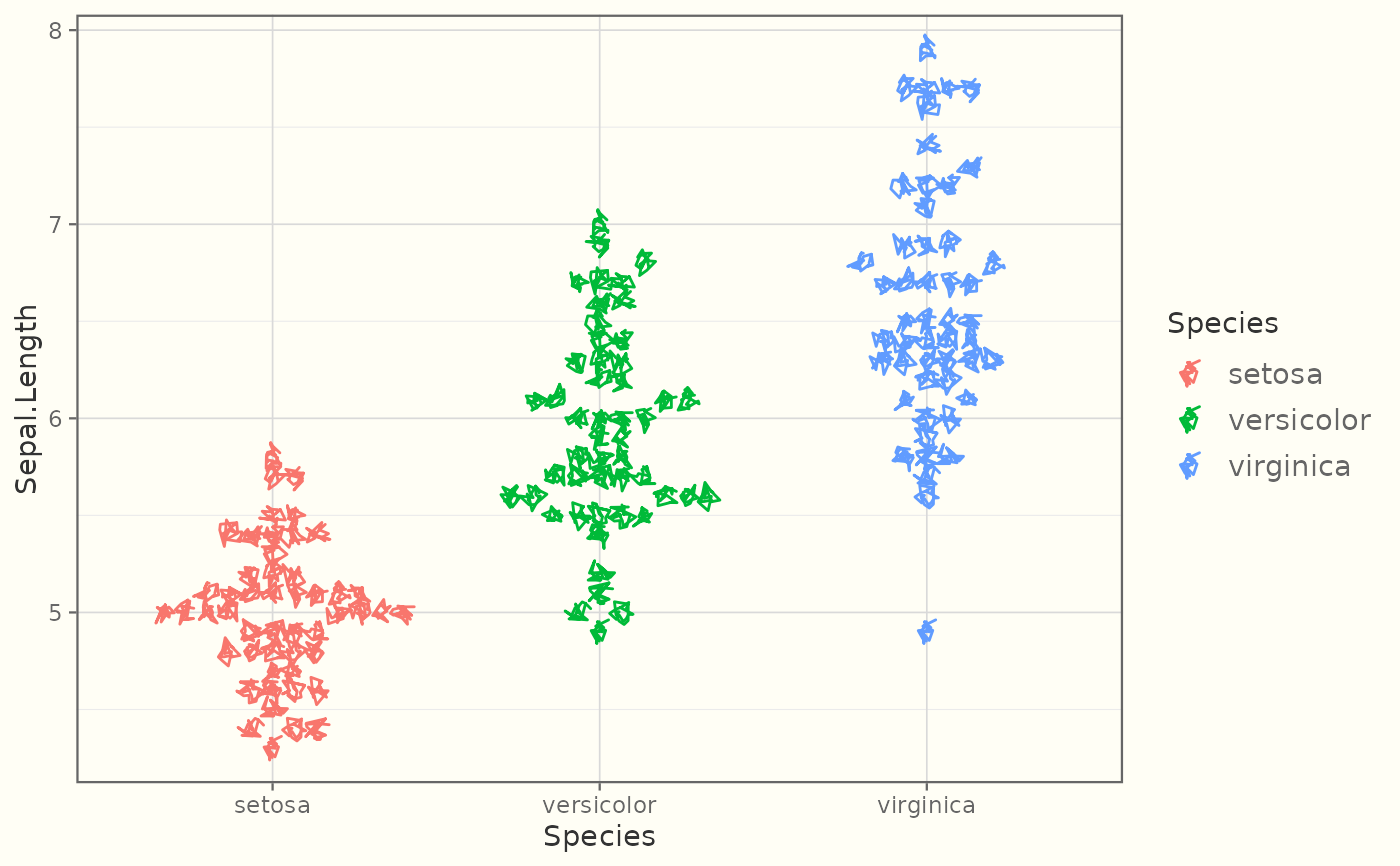
Draws a hand-drawn beeswarm (dot-strip) plot: at each categorical x, the
points are nudged sideways so they no longer overlap, so the width of the
swarm reads as the local density of y. The sideways offset is computed
deterministically in data space (bin y, then fan each bin symmetrically
around the category centre), so it is fully reproducible and device
independent. Dots are drawn with geom_sketch_point(), so they keep the
usual hand-drawn wobble (cf. ggbeeswarm::geom_beeswarm()).
Usage
StatSketchBeeswarm

geom_sketch_beeswarm(
  mapping = NULL,
  data = NULL,
  stat = "sketch_beeswarm",
  position = "identity",
  ...,
  binwidth = NULL,
  nbins = 30L,
  width = NULL,
  roughness = NULL,
  n_passes = 2L,
  seed = NULL,
  na.rm = FALSE,
  show.legend = NA,
  inherit.aes = TRUE
)
Arguments
- mapping
Aesthetic mappings created by
ggplot2::aes(). Requiresx(usually discrete) andy.- data
Data to display.
- stat
Statistical transformation. Default
"sketch_beeswarm".- position
Position adjustment. Default
"identity".- ...
Other arguments passed on to the layer.
- binwidth
Height of the
ybins used to group points into rows. DefaultNULLchoosesnbinseven bins across theyrange.- nbins
Number of
ybins whenbinwidthisNULL. Default 30.- width
Sideways spacing between adjacent points in a row, in category units. Default
NULLauto-sizes so the widest row stays within the category. Increase for a wider swarm.- roughness
Point roughness. Default
NULL(the geom default).- n_passes
Number of stroke passes. Default 2.
- seed
Integer seed.
NULLusesgetOption("ggsketch.seed", 1L).- na.rm
Remove missing values silently? Default
FALSE.- show.legend
Logical; include in legend?
- inherit.aes
Override default aesthetics?
See also
Other sketch-geoms:
GeomSketchAbline,
GeomSketchArrow,
GeomSketchBoxplot,
GeomSketchBracket,
GeomSketchCallout,
GeomSketchChicklet,
GeomSketchCol,
GeomSketchContourFilled,
GeomSketchCurve,
GeomSketchDotplot,
GeomSketchDumbbell,
GeomSketchEdge,
GeomSketchEllipse,
GeomSketchEngrave,
GeomSketchGantt,
GeomSketchHex,
GeomSketchLine,
GeomSketchLinerange,
GeomSketchLollipop,
GeomSketchMarkCircle,
GeomSketchMarkHull,
GeomSketchPath,
GeomSketchPoint,
GeomSketchPolygon,
GeomSketchRect,
GeomSketchRibbon,
GeomSketchRug,
GeomSketchSegment,
GeomSketchSfPolygon,
GeomSketchSlope,
GeomSketchSmooth,
GeomSketchSpoke,
GeomSketchTextRepel,
GeomSketchViolin,
StatSketchCalendar,
StatSketchDensityRidges,
StatSketchFunnel,
StatSketchPie,
StatSketchPyramid,
StatSketchRadar,
StatSketchStream,
StatSketchTreemap,
StatSketchWaffle,
StatSketchWaterfall,
annotate_sketch(),
annotate_sketch_arrow(),
annotate_sketch_callout(),
annotate_sketch_highlight(),
geom_sketch_alluvial(),
geom_sketch_arc_diagram(),
geom_sketch_bin2d(),
geom_sketch_bump(),
geom_sketch_chord(),
geom_sketch_contour(),
geom_sketch_count(),
geom_sketch_dendrogram(),
geom_sketch_density(),
geom_sketch_density2d(),
geom_sketch_ecdf(),
geom_sketch_function(),
geom_sketch_histogram(),
geom_sketch_jitter(),
geom_sketch_marimekko(),
geom_sketch_mosaic(),
geom_sketch_parallel(),
geom_sketch_qq(),
geom_sketch_quantile(),
geom_sketch_rose(),
geom_sketch_sunburst(),
geom_sketch_text(),
sketch_graph()
Examples
library(ggplot2)
ggplot(iris, aes(Species, Sepal.Length, colour = Species)) +
  geom_sketch_beeswarm(seed = 1L) +
  theme_sketch()