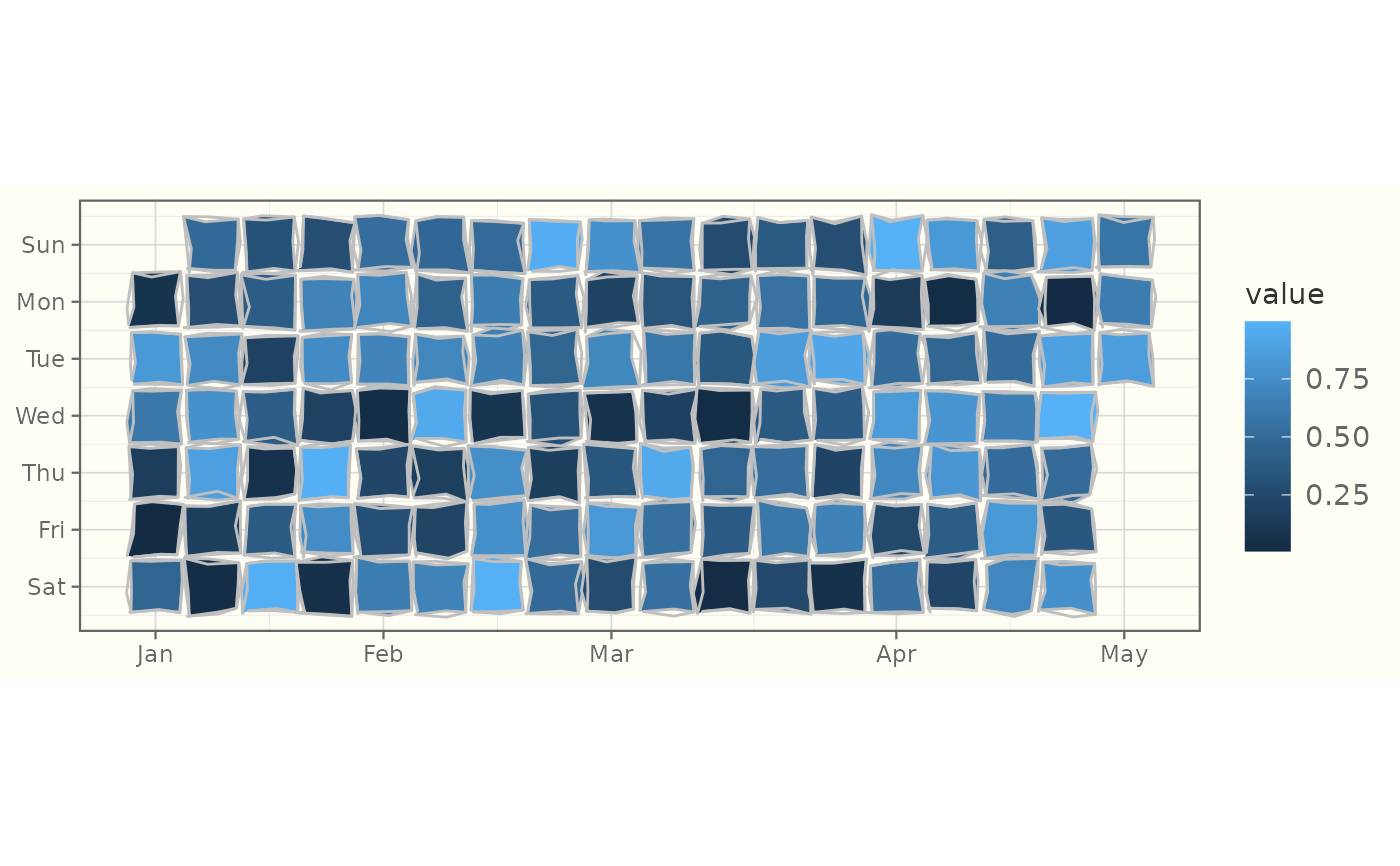
Draws a hand-drawn calendar heatmap in the GitHub-contributions style: one
roughened tile per day, arranged as weeks (columns) and weekdays (rows), with
the tile colour given by a value, and the axes labelled with weekday and
month names. Map date (a Date) and fill (the value).
Tiles are drawn with geom_sketch_tile(); the default fill_style = "solid"
lets the colour gradient read as a heatmap. For more than one year, add a year
column to your data and facet on it (each panel covers one year). No new
dependencies.
Usage
StatSketchCalendar

geom_sketch_calendar(
  mapping = NULL,
  data = NULL,
  stat = "sketch_calendar",
  position = "identity",
  ...,
  week_start = "sunday",
  labels = TRUE,
  width = 0.9,
  height = 0.9,
  colour = "grey75",
  fill_style = "solid",
  roughness = 1,
  bowing = 1,
  n_passes = 2L,
  seed = NULL,
  na.rm = FALSE,
  show.legend = NA,
  inherit.aes = TRUE
)
Arguments
- mapping
Aesthetic mappings created by
ggplot2::aes(). Requiresdate; usually mapfillto the value.- data
Data to display.
- stat
Statistical transformation. Default
"sketch_calendar".- position
Position adjustment. Default
"identity".- ...
Other arguments passed on to the layer.
- week_start
"sunday"(default) or"monday": which weekday is the top row.- labels
Label the axes with weekday and month names instead of the raw grid numbers? Default
TRUE; it returns the layer together with x/y scales, so setFALSEif you want to supply your own scales. Month positions are exact to within one week (they are computed without seeing the year).- width, height
Tile size in grid units (gaps appear below 1). Default 0.9.
- colour
Tile outline colour. Default
"grey75"(setNAfor none).- fill_style
Tile fill style; see
geom_sketch_rect(). Default"solid"(best for a colour-graded heatmap).- roughness, bowing, n_passes, seed
Sketch parameters.
- na.rm
Remove missing values silently? Default
FALSE.- show.legend
Logical; include in legend?
- inherit.aes
Override default aesthetics?
Value
A ggplot2 layer object (with labels = TRUE, a list of the layer
plus weekday/month axis scales).
See also
Other sketch-geoms:
GeomSketchAbline,
GeomSketchArrow,
GeomSketchBoxplot,
GeomSketchBracket,
GeomSketchCallout,
GeomSketchChicklet,
GeomSketchCol,
GeomSketchContourFilled,
GeomSketchCurve,
GeomSketchDotplot,
GeomSketchDumbbell,
GeomSketchEdge,
GeomSketchEllipse,
GeomSketchEngrave,
GeomSketchGantt,
GeomSketchHex,
GeomSketchLine,
GeomSketchLinerange,
GeomSketchLollipop,
GeomSketchMarkCircle,
GeomSketchMarkHull,
GeomSketchPath,
GeomSketchPoint,
GeomSketchPolygon,
GeomSketchRect,
GeomSketchRibbon,
GeomSketchRug,
GeomSketchSegment,
GeomSketchSfPolygon,
GeomSketchSlope,
GeomSketchSmooth,
GeomSketchSpoke,
GeomSketchTextRepel,
GeomSketchViolin,
StatSketchBeeswarm,
StatSketchDensityRidges,
StatSketchFunnel,
StatSketchPie,
StatSketchPyramid,
StatSketchRadar,
StatSketchStream,
StatSketchTreemap,
StatSketchWaffle,
StatSketchWaterfall,
annotate_sketch(),
annotate_sketch_arrow(),
annotate_sketch_callout(),
annotate_sketch_highlight(),
geom_sketch_alluvial(),
geom_sketch_arc_diagram(),
geom_sketch_bin2d(),
geom_sketch_bump(),
geom_sketch_chord(),
geom_sketch_contour(),
geom_sketch_count(),
geom_sketch_dendrogram(),
geom_sketch_density(),
geom_sketch_density2d(),
geom_sketch_ecdf(),
geom_sketch_function(),
geom_sketch_histogram(),
geom_sketch_jitter(),
geom_sketch_marimekko(),
geom_sketch_mosaic(),
geom_sketch_parallel(),
geom_sketch_qq(),
geom_sketch_quantile(),
geom_sketch_rose(),
geom_sketch_sunburst(),
geom_sketch_text(),
sketch_graph()
Examples
library(ggplot2)
df <- data.frame(day = as.Date("2024-01-01") + 0:120)
df$value <- runif(nrow(df))
ggplot(df, aes(date = day, fill = value)) +
  geom_sketch_calendar(seed = 1L) +
  coord_equal() +
  theme_sketch()