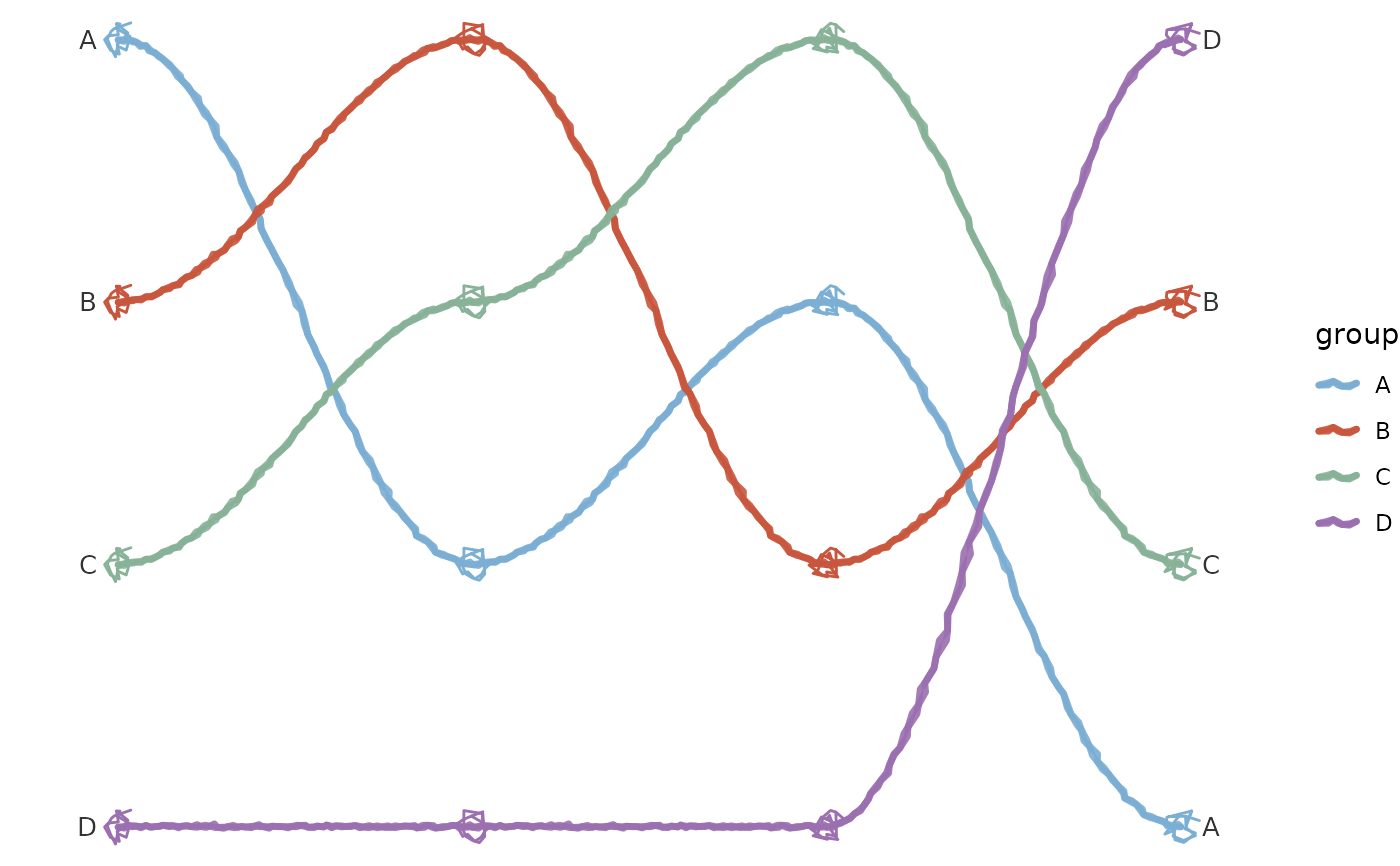
Draws a hand-drawn bump chart: each series' rank at every time point, joined
across adjacent times by smooth roughened curves so a crossing reads as one
series overtaking another. Like geom_sketch_alluvial() it is a constructor
returning a list of ordinary sketch layers (connector ribbons, rank points and
end labels), so it composes with +; map a colour scale over the series and
pair with theme_void() or theme_sketch(). No new dependencies
(cf. ggbump).
Usage
geom_sketch_bump(
  data,
  x,
  group,
  value,
  ...,
  direction = c("desc", "asc"),
  point_size = 3,
  line_width = 1.2,
  alpha = 0.9,
  label = TRUE,
  label_size = 3.5,
  label_colour = "grey20",
  roughness = 1,
  bowing = 1,
  n_passes = 2L,
  seed = NULL
)
Arguments
- data
A long data frame (one row per series per time point).
- x, group, value
Unquoted column names: the (ordinal) time, the series, and the value ranked within each time.
- ...
Other arguments passed on to the connector layer.
- direction
"desc"(default) ranks the highestvalueas rank 1, drawn at the top;"asc"flips it.- point_size
Size of the rank points. Default 3.
- line_width
Connector line width. Default 1.2.
- alpha
Connector opacity. Default 0.9.
- label
Draw series labels at the first and last time point? Default
TRUE.- label_size, label_colour
Label text controls.
- roughness, bowing, n_passes, seed
Sketch parameters.
See also
Other sketch-geoms:
GeomSketchAbline,
GeomSketchArrow,
GeomSketchBoxplot,
GeomSketchBracket,
GeomSketchCallout,
GeomSketchChicklet,
GeomSketchCol,
GeomSketchContourFilled,
GeomSketchCurve,
GeomSketchDotplot,
GeomSketchDumbbell,
GeomSketchEdge,
GeomSketchEllipse,
GeomSketchEngrave,
GeomSketchGantt,
GeomSketchHex,
GeomSketchLine,
GeomSketchLinerange,
GeomSketchLollipop,
GeomSketchMarkCircle,
GeomSketchMarkHull,
GeomSketchPath,
GeomSketchPoint,
GeomSketchPolygon,
GeomSketchRect,
GeomSketchRibbon,
GeomSketchRug,
GeomSketchSegment,
GeomSketchSfPolygon,
GeomSketchSlope,
GeomSketchSmooth,
GeomSketchSpoke,
GeomSketchTextRepel,
GeomSketchViolin,
StatSketchBeeswarm,
StatSketchCalendar,
StatSketchDensityRidges,
StatSketchFunnel,
StatSketchPie,
StatSketchPyramid,
StatSketchRadar,
StatSketchStream,
StatSketchTreemap,
StatSketchWaffle,
StatSketchWaterfall,
annotate_sketch(),
annotate_sketch_arrow(),
annotate_sketch_callout(),
annotate_sketch_highlight(),
geom_sketch_alluvial(),
geom_sketch_arc_diagram(),
geom_sketch_bin2d(),
geom_sketch_chord(),
geom_sketch_contour(),
geom_sketch_count(),
geom_sketch_dendrogram(),
geom_sketch_density(),
geom_sketch_density2d(),
geom_sketch_ecdf(),
geom_sketch_function(),
geom_sketch_histogram(),
geom_sketch_jitter(),
geom_sketch_marimekko(),
geom_sketch_mosaic(),
geom_sketch_parallel(),
geom_sketch_qq(),
geom_sketch_quantile(),
geom_sketch_rose(),
geom_sketch_sunburst(),
geom_sketch_text(),
sketch_graph()
Examples
library(ggplot2)
df <- data.frame(
  year = rep(2018:2021, each = 4),
  team = rep(c("A", "B", "C", "D"), times = 4),
  pts  = c(10, 8, 6, 4,  6, 10, 8, 4,  8, 6, 10, 5,  4, 8, 6, 12)
)
ggplot() +
  geom_sketch_bump(df, year, team, pts, seed = 1L) +
  scale_colour_sketch() +
  theme_void()