Draws vertical bars with a hand-drawn roughened outline and an optional
hachure, cross-hatch, zigzag, dots, or dashed fill pattern. Use
geom_sketch_col() when the bar heights are already in the data; use
geom_sketch_bar() to count observations automatically.
Usage
GeomSketchCol

geom_sketch_col(
  mapping = NULL,
  data = NULL,
  stat = "identity",
  position = "stack",
  ...,
  roughness = 1,
  bowing = 1,
  n_passes = 2L,
  seed = NULL,
  fill_style = "hachure",
  hachure_angle = 45,
  hachure_gap = NULL,
  fill_weight = 0.5,
  width = NULL,
  na.rm = FALSE,
  show.legend = NA,
  inherit.aes = TRUE
)

geom_sketch_bar(
  mapping = NULL,
  data = NULL,
  stat = "count",
  position = "stack",
  ...,
  roughness = 1,
  bowing = 1,
  n_passes = 2L,
  seed = NULL,
  fill_style = "hachure",
  hachure_angle = 45,
  hachure_gap = NULL,
  fill_weight = 0.5,
  width = NULL,
  na.rm = FALSE,
  show.legend = NA,
  inherit.aes = TRUE
)Arguments
- mapping
Set of aesthetic mappings created by
ggplot2::aes().- data
Data to display.
- stat
Statistical transformation. Default
"identity"forgeom_sketch_col();"count"forgeom_sketch_bar().- position
Position adjustment. Default
"stack".- ...
Other arguments passed on to the layer.
- roughness
Non-negative roughness (0 = straight lines). Default 1.
- bowing
Non-negative bowing multiplier. Default 1.
- n_passes
Number of stroke passes. Default 2.
- seed
Integer seed.
NULLusesgetOption("ggsketch.seed", 1L).- fill_style
One of
"hachure","cross_hatch","zigzag","zigzag_line","scribble","dots","dashed", or"solid". Default"hachure".- hachure_angle
Fill line angle in degrees. Default 45.
- hachure_gap
Fill line gap in data units (
NULL= 15% of bar width).- fill_weight
Stroke weight for fill lines. Default 0.5.
- width
Bar width override.
NULLuses 90% of resolution.- na.rm
Remove missing values silently? Default
FALSE.- show.legend
Logical; include in legend?
- inherit.aes
Override default aesthetics?
See also
Other sketch-geoms:
GeomSketchAbline,
GeomSketchBoxplot,
GeomSketchBracket,
GeomSketchCurve,
GeomSketchEllipse,
GeomSketchHex,
GeomSketchLine,
GeomSketchLinerange,
GeomSketchPath,
GeomSketchPoint,
GeomSketchPolygon,
GeomSketchRect,
GeomSketchRibbon,
GeomSketchRug,
GeomSketchSegment,
GeomSketchSmooth,
GeomSketchSpoke,
GeomSketchViolin,
annotate_sketch(),
geom_sketch_bin2d(),
geom_sketch_contour(),
geom_sketch_count(),
geom_sketch_density(),
geom_sketch_density2d(),
geom_sketch_function(),
geom_sketch_histogram(),
geom_sketch_jitter(),
geom_sketch_qq(),
geom_sketch_quantile(),
geom_sketch_text()
Examples
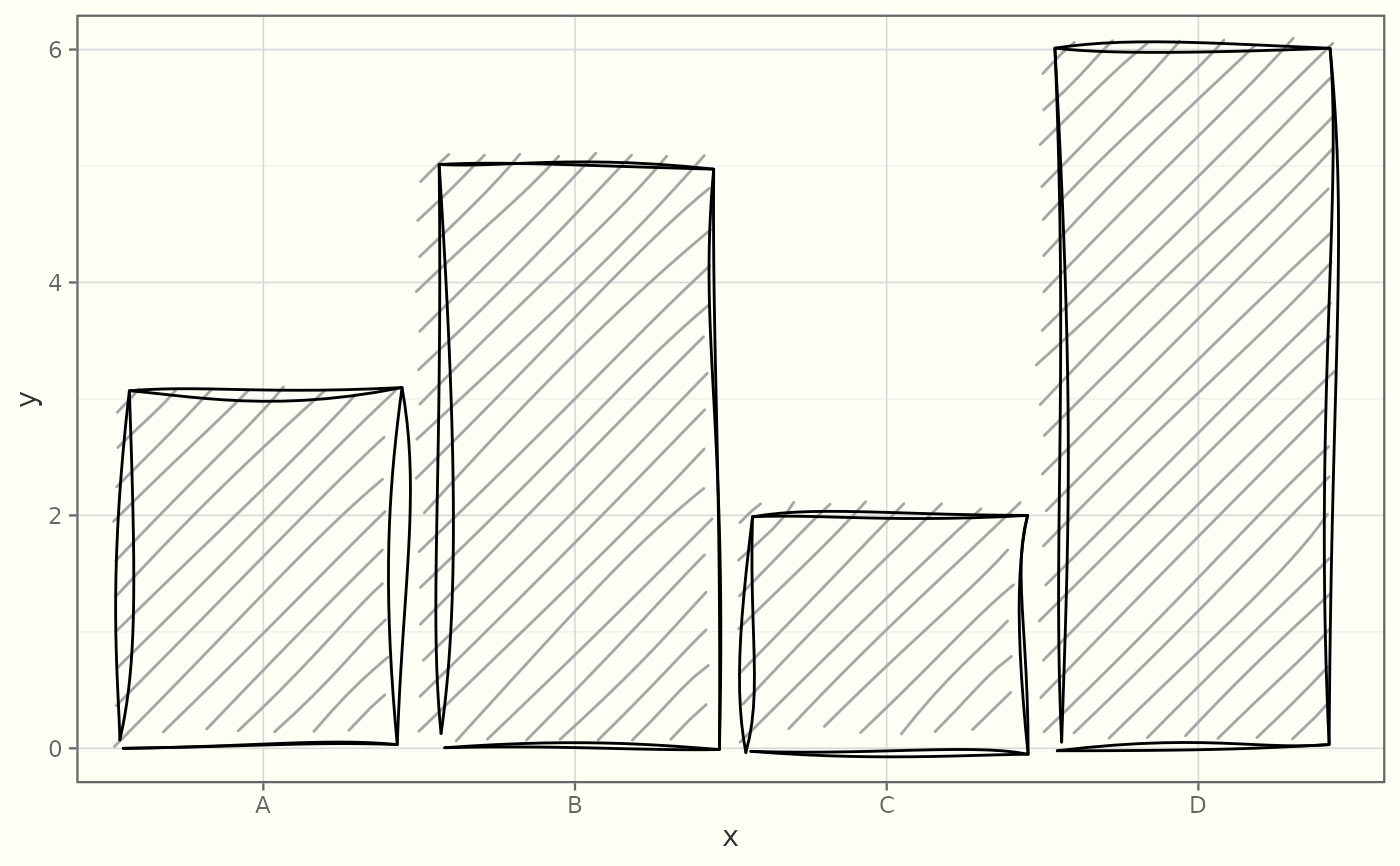
library(ggplot2)
df <- data.frame(x = c("A","B","C","D"), y = c(3, 5, 2, 6))
ggplot(df, aes(x, y)) +
  geom_sketch_col(fill_style = "hachure", seed = 1L) +
  theme_sketch()