Draws a hand-drawn bracket spanning xmin to xmax at height y, with short
tips dropping toward the data and an optional label (e.g. a p-value or
"n.s.") centred above. It is the sketch counterpart of a ggsignif bracket:
useful for marking pairwise comparisons on boxplots, bars, or violins.
Usage
GeomSketchBracket

geom_sketch_bracket(
  mapping = NULL,
  data = NULL,
  stat = "identity",
  position = "identity",
  ...,
  tip_length = 0.02,
  family = NULL,
  label_vjust = -0.35,
  roughness = 0.8,
  bowing = 0.4,
  n_passes = 2L,
  seed = NULL,
  na.rm = FALSE,
  show.legend = FALSE,
  inherit.aes = FALSE
)Arguments
- mapping
Aesthetic mappings created by
ggplot2::aes(). Requiresxmin,xmax, andy;labelis optional.- data
Data with one row per bracket.
- stat
Statistical transformation. Default
"identity".- position
Position adjustment. Default
"identity".- ...
Other arguments passed on to the layer.
- tip_length
Length of the downward end tips, as a fraction of panel height. Default
0.02. Use0for a plain bar.- family
Font family for the label. By default the first installed handwriting face is used (see
ggsketch_check_fonts()); pass""for the device default.- label_vjust
Vertical justification of the label relative to the bar (negative nudges it above). Default
-0.35.- roughness
Non-negative roughness (0 = straight). Default 0.8.
- bowing
Non-negative bowing multiplier. Default 0.4 (kept low so the bar stays readable).
- n_passes
Number of stroke passes. Default 2.
- seed
Integer seed.
NULLusesgetOption("ggsketch.seed", 1L).- na.rm
Remove missing values silently? Default
FALSE.- show.legend
Logical; include in legend? Default
FALSE.- inherit.aes
Inherit aesthetics from the plot? Default
FALSE.
Details
Brackets are usually one-off annotations, so supply them with their own
data and inherit.aes = FALSE rather than inheriting the plot's mapping.
See also
Other sketch-geoms:
GeomSketchAbline,
GeomSketchBoxplot,
GeomSketchCol,
GeomSketchCurve,
GeomSketchEllipse,
GeomSketchHex,
GeomSketchLine,
GeomSketchLinerange,
GeomSketchPath,
GeomSketchPoint,
GeomSketchPolygon,
GeomSketchRect,
GeomSketchRibbon,
GeomSketchRug,
GeomSketchSegment,
GeomSketchSmooth,
GeomSketchSpoke,
GeomSketchViolin,
annotate_sketch(),
geom_sketch_bin2d(),
geom_sketch_contour(),
geom_sketch_count(),
geom_sketch_density(),
geom_sketch_density2d(),
geom_sketch_function(),
geom_sketch_histogram(),
geom_sketch_jitter(),
geom_sketch_qq(),
geom_sketch_quantile(),
geom_sketch_text()
Examples
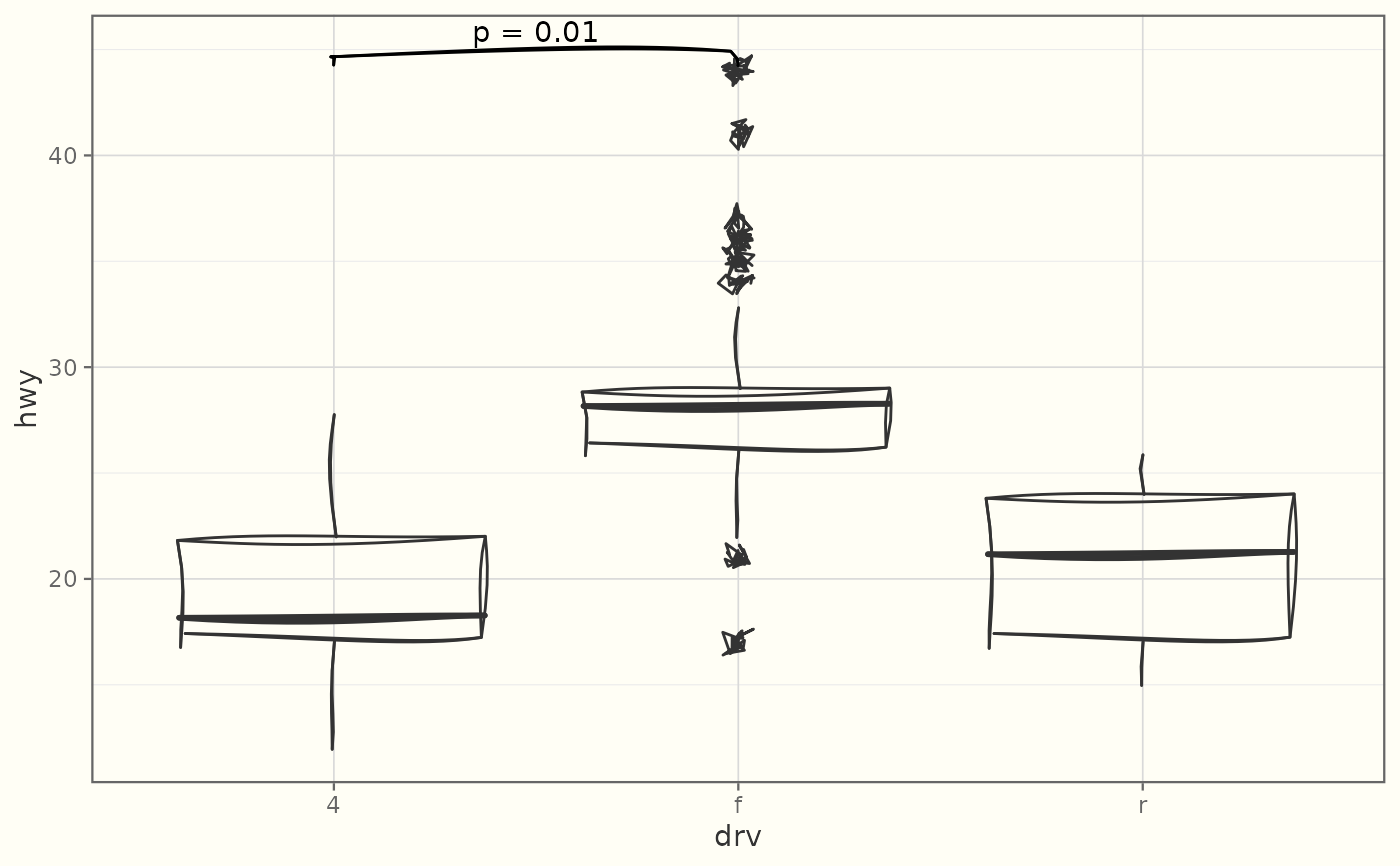
library(ggplot2)
brackets <- data.frame(xmin = 1, xmax = 2, y = 45, label = "p = 0.01")
ggplot(mpg, aes(drv, hwy)) +
  geom_sketch_boxplot(seed = 1L) +
  geom_sketch_bracket(
    data = brackets,
    aes(xmin = xmin, xmax = xmax, y = y, label = label),
    family = "", seed = 2L
  ) +
  theme_sketch()