Draws points as small roughened glyphs, giving each a hand-drawn feel.
Equivalent to geom_point() with a sketch aesthetic.
Usage
GeomSketchPoint

geom_sketch_point(
  mapping = NULL,
  data = NULL,
  stat = "identity",
  position = "identity",
  ...,
  roughness = NULL,
  bowing = NULL,
  n_passes = 2L,
  seed = NULL,
  fill_style = "solid",
  hachure_angle = 45,
  hachure_gap = NULL,
  fill_weight = 0.5,
  fill_roughness = NULL,
  fill_seed = NULL,
  na.rm = FALSE,
  show.legend = NA,
  inherit.aes = TRUE
)
Arguments
- mapping
Set of aesthetic mappings. Supports
x,y,colour,fill,shape,size,stroke,alpha, androughness.- data
Data to display.
- stat
Statistical transformation (default
"identity").- position
Position adjustment (default
"identity").- ...
Other arguments passed on to the layer.
- roughness
Non-negative roughness parameter (0 = straight). Default 1.
- bowing
Non-negative bowing multiplier. Default 1.
- n_passes
Number of stroke passes for the double-stroke effect. Default 2.
- seed
Integer seed for reproducibility.
NULLusesgetOption("ggsketch.seed", 1L).- fill_style
How the inside of a filled shape is drawn:
"solid"(default) paints it;"hachure","cross_hatch","zigzag","scribble","dots", and the other styles ofgeom_sketch_polygon()(except"watercolor") hatch it, which reads best on larger points.- hachure_angle, hachure_gap, fill_weight, fill_roughness, fill_seed
Fill settings for the hatched styles, as in
geom_sketch_polygon().hachure_gapis in inches;NULLpicks it from each point's size.- na.rm
If
FALSE(default), missing values are removed with a warning.- show.legend
Logical. Should this layer be included in the legend?
- inherit.aes
If
FALSE, override the default aesthetics.
Details
Unlike the other geoms, roughness is a mappable aesthetic here: set it to a
constant (geom_sketch_point(roughness = 2)) so every point wobbles the same
amount, or map it to a variable (aes(roughness = z)) so each point wobbles
more or less. A mapped variable is rescaled to a legible roughness band by
scale_roughness_continuous() (the default range is c(0.01, 0.75)), exactly
as scale_size() rescales to a size range. Wrap values in base::I() to use
them as raw roughness instead.
Shapes
shape takes ggplot2's point shapes 0-25, by number or by name ("square",
"triangle filled", ...), each drawn as a hand-drawn glyph at the size R
draws it. The default, shape 1, is an open circle. The solid shapes 15-20
are filled with the point's colour and shapes 21-25 with its fill, so
mapping a variable to shape gives filled glyphs, as in geom_point(); use
scale_shape(solid = FALSE) for open ones. Filled points are drawn one at a
time, fill then outline, so overlapping points stack in data order. Any other
shape (a single character, say) is drawn as an ordinary point.
See also
scale_roughness_continuous() to control how a mapped variable is
turned into roughness.
Other sketch-geoms:
GeomSketchAbline,
GeomSketchArrow,
GeomSketchBoxplot,
GeomSketchBracket,
GeomSketchCallout,
GeomSketchChicklet,
GeomSketchCol,
GeomSketchContourFilled,
GeomSketchCurve,
GeomSketchDotplot,
GeomSketchDumbbell,
GeomSketchEdge,
GeomSketchEllipse,
GeomSketchEngrave,
GeomSketchGantt,
GeomSketchHex,
GeomSketchLine,
GeomSketchLinerange,
GeomSketchLollipop,
GeomSketchMarkCircle,
GeomSketchMarkHull,
GeomSketchNote,
GeomSketchPath,
GeomSketchPolygon,
GeomSketchRect,
GeomSketchRibbon,
GeomSketchRug,
GeomSketchSegment,
GeomSketchSfPolygon,
GeomSketchSlope,
GeomSketchSmooth,
GeomSketchSpoke,
GeomSketchTextRepel,
GeomSketchViolin,
StatSketchBeeswarm,
StatSketchCalendar,
StatSketchDensityRidges,
StatSketchFunnel,
StatSketchPie,
StatSketchPyramid,
StatSketchRadar,
StatSketchStream,
StatSketchTreemap,
StatSketchWaffle,
StatSketchWaterfall,
annotate_sketch(),
annotate_sketch_arrow(),
annotate_sketch_callout(),
annotate_sketch_highlight(),
annotate_sketch_note(),
geom_sketch_alluvial(),
geom_sketch_arc_diagram(),
geom_sketch_bin2d(),
geom_sketch_bump(),
geom_sketch_chord(),
geom_sketch_contour(),
geom_sketch_count(),
geom_sketch_dendrogram(),
geom_sketch_density(),
geom_sketch_density2d(),
geom_sketch_ecdf(),
geom_sketch_function(),
geom_sketch_histogram(),
geom_sketch_jitter(),
geom_sketch_marimekko(),
geom_sketch_mosaic(),
geom_sketch_parallel(),
geom_sketch_point_interactive(),
geom_sketch_qq(),
geom_sketch_quantile(),
geom_sketch_rose(),
geom_sketch_sunburst(),
geom_sketch_text(),
sketch_graph()
Examples
library(ggplot2)
ggplot(mtcars, aes(wt, mpg)) +
geom_sketch_point(roughness = 0.5, seed = 1L)
 # A constant sets how wobbly every point is.
ggplot(mtcars, aes(wt, mpg)) +
geom_sketch_point(roughness = 0, size = 3, seed = 1L) # clean circles
 ggplot(mtcars, aes(wt, mpg)) +
geom_sketch_point(roughness = 1.5, size = 3, seed = 1L) # very sketchy
 # Map roughness to a variable: rescaled to c(0.01, 0.75) by default.
ggplot(mtcars, aes(wt, mpg, roughness = hp)) +
geom_sketch_point(size = 3, seed = 1L)
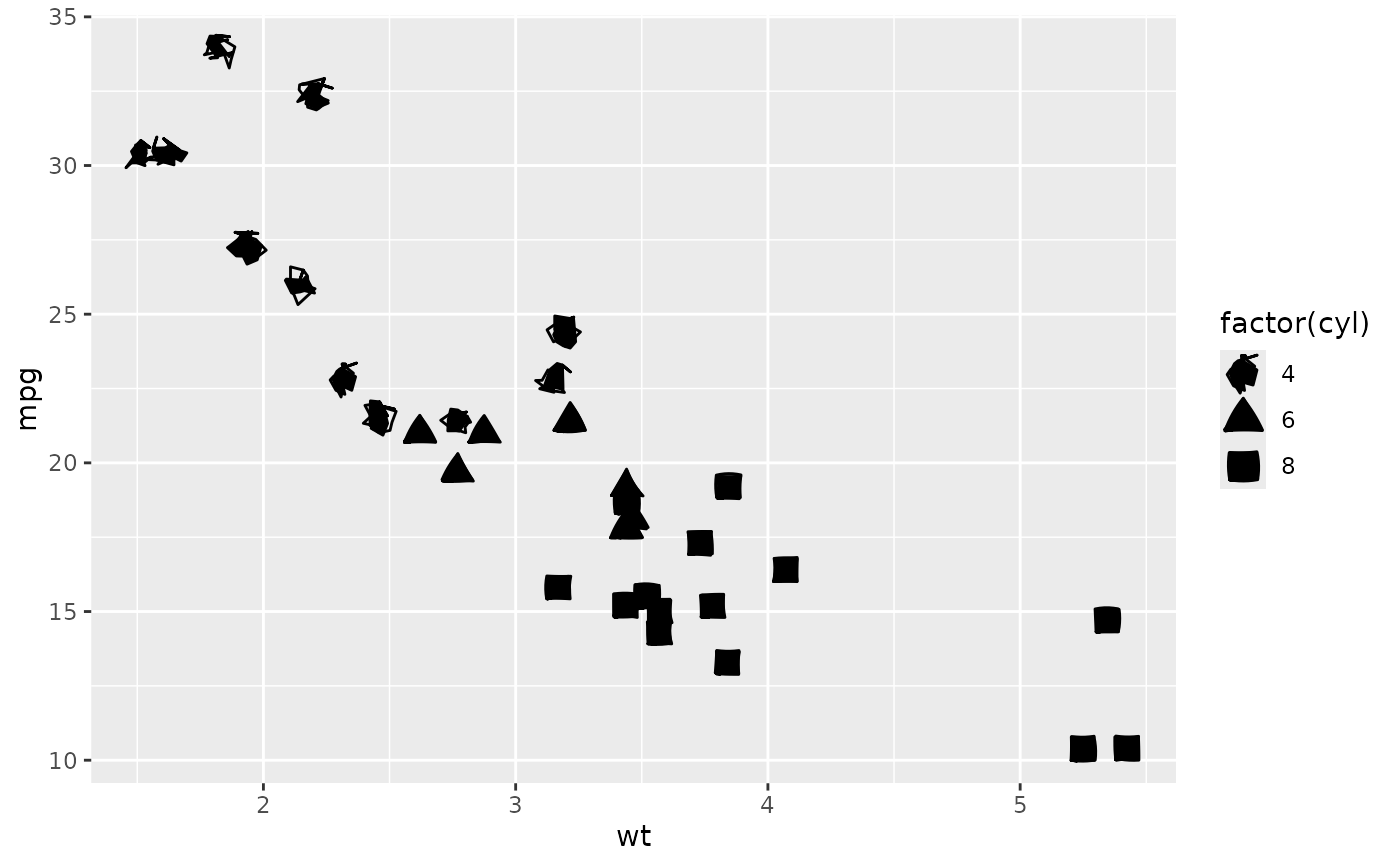
 # Shapes: map a variable, or fill shapes 21-25.
ggplot(mtcars, aes(wt, mpg, shape = factor(cyl))) +
geom_sketch_point(size = 3, seed = 1L)
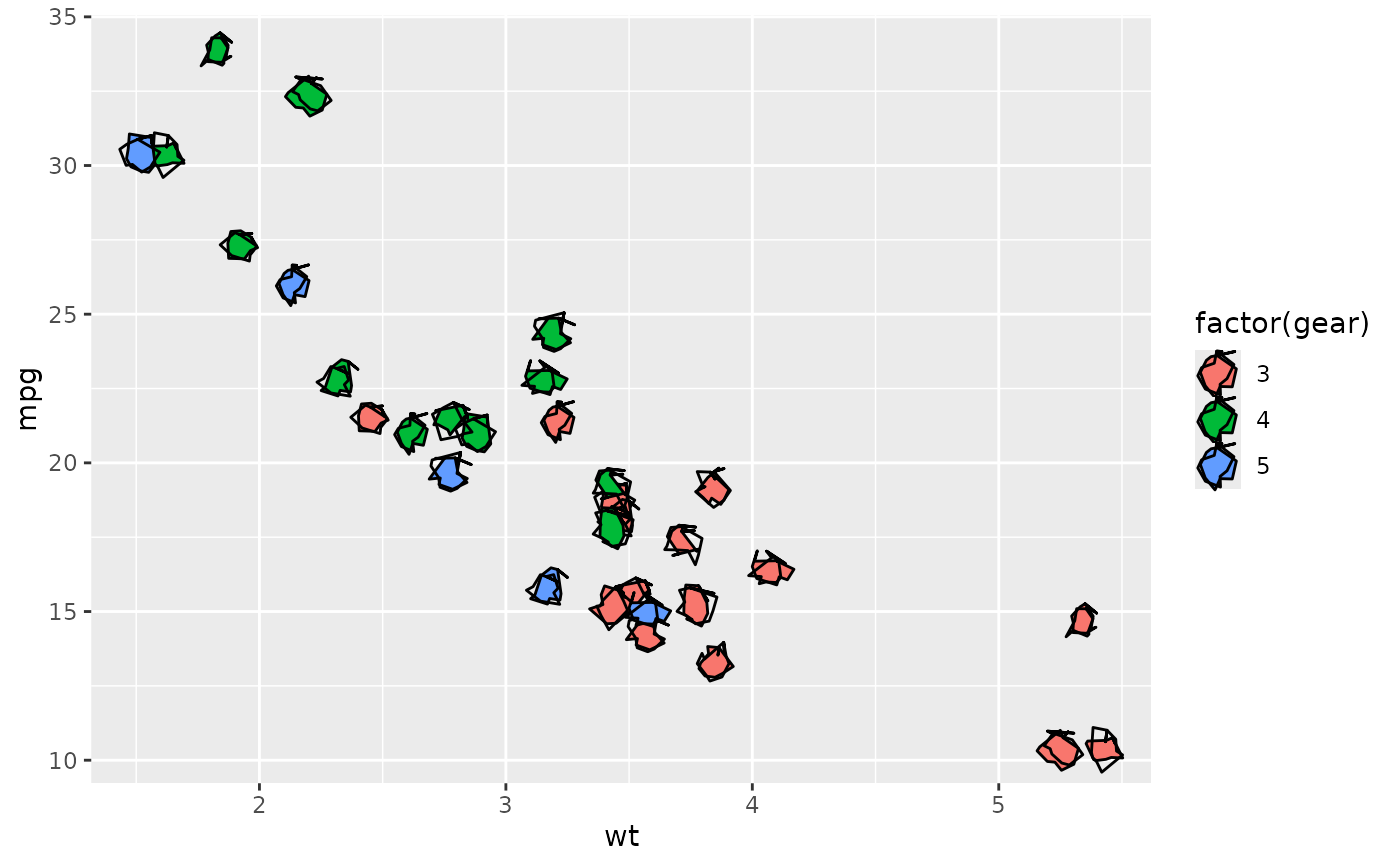
 ggplot(mtcars, aes(wt, mpg, fill = factor(gear))) +
geom_sketch_point(shape = 21, size = 4, seed = 1L)
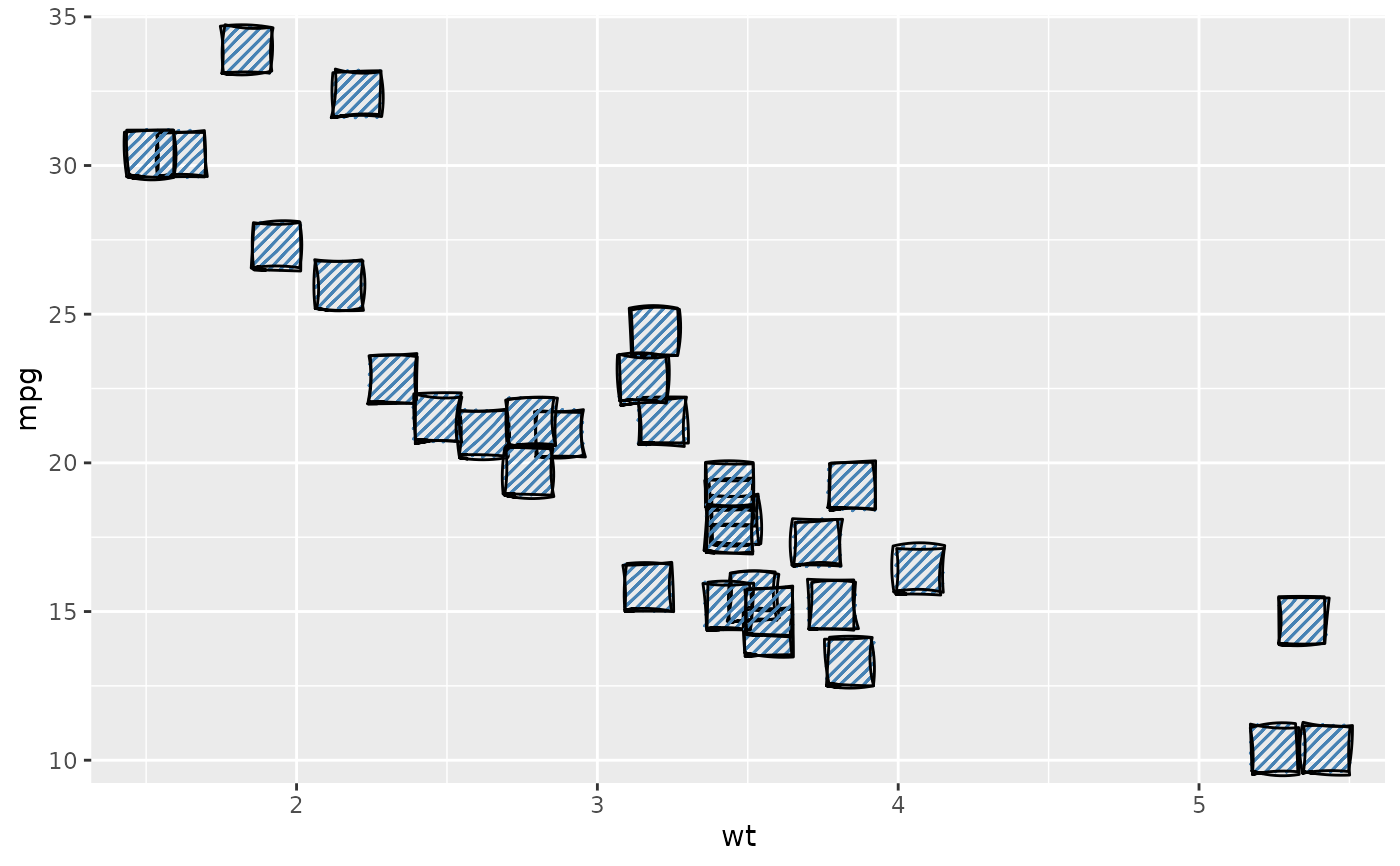
 # Hatch big filled points instead of painting them.
ggplot(mtcars, aes(wt, mpg)) +
geom_sketch_point(shape = 22, fill = "steelblue", size = 7,
fill_style = "hachure", seed = 1L)