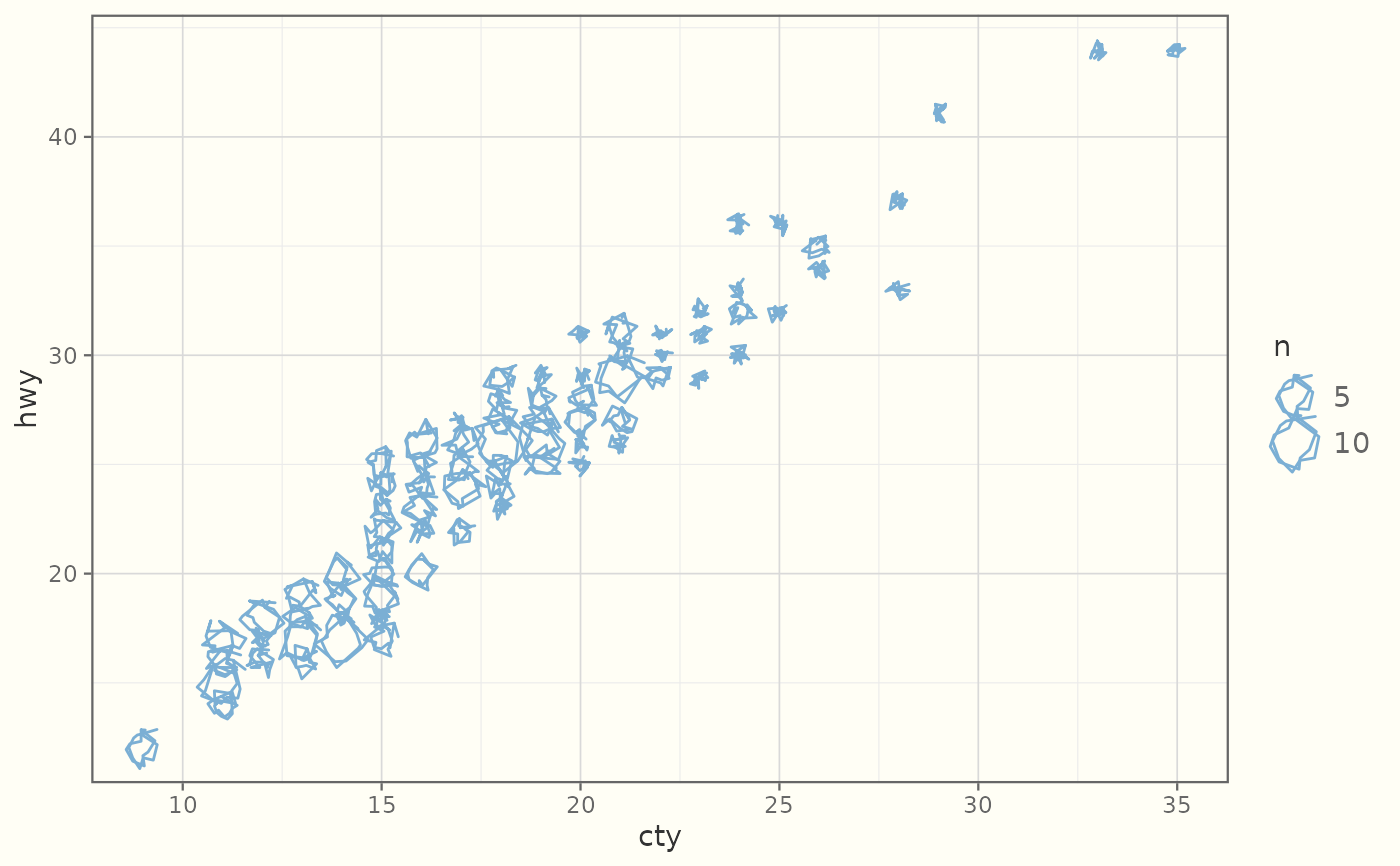
Like ggplot2::geom_count(): draws a sketch point at each (x, y) location
sized by the number of observations there, via ggplot2::stat_sum(). Pair
with ggplot2::scale_size_area() for honest area scaling.
Usage
geom_sketch_count(
  mapping = NULL,
  data = NULL,
  stat = "sum",
  position = "identity",
  ...,
  roughness = 0.5,
  bowing = 1,
  n_passes = 2L,
  seed = NULL,
  na.rm = FALSE,
  show.legend = NA,
  inherit.aes = TRUE
)
Arguments
- mapping
Set of aesthetic mappings. Supports
x,y,colour,size,alpha, androughness.- data
Data to display.
- stat
Statistical transformation (default
"identity").- position
Position adjustment (default
"identity").- ...
Other arguments passed on to the layer.
- roughness
Non-negative roughness parameter (0 = straight). Default 1.
- bowing
Non-negative bowing multiplier. Default 1.
- n_passes
Number of stroke passes for the double-stroke effect. Default 2.
- seed
Integer seed for reproducibility.
NULLusesgetOption("ggsketch.seed", 1L).- na.rm
If
FALSE(default), missing values are removed with a warning.- show.legend
Logical. Should this layer be included in the legend?
- inherit.aes
If
FALSE, override the default aesthetics.
See also
Other sketch-geoms:
GeomSketchAbline,
GeomSketchBoxplot,
GeomSketchBracket,
GeomSketchCol,
GeomSketchCurve,
GeomSketchEllipse,
GeomSketchHex,
GeomSketchLine,
GeomSketchLinerange,
GeomSketchPath,
GeomSketchPoint,
GeomSketchPolygon,
GeomSketchRect,
GeomSketchRibbon,
GeomSketchRug,
GeomSketchSegment,
GeomSketchSmooth,
GeomSketchSpoke,
GeomSketchViolin,
annotate_sketch(),
geom_sketch_bin2d(),
geom_sketch_contour(),
geom_sketch_density(),
geom_sketch_density2d(),
geom_sketch_function(),
geom_sketch_histogram(),
geom_sketch_jitter(),
geom_sketch_qq(),
geom_sketch_quantile(),
geom_sketch_text()
Examples
library(ggplot2)
ggplot(mpg, aes(cty, hwy)) +
  geom_sketch_count(colour = "#7BAFD4", seed = 1L) +
  theme_sketch()