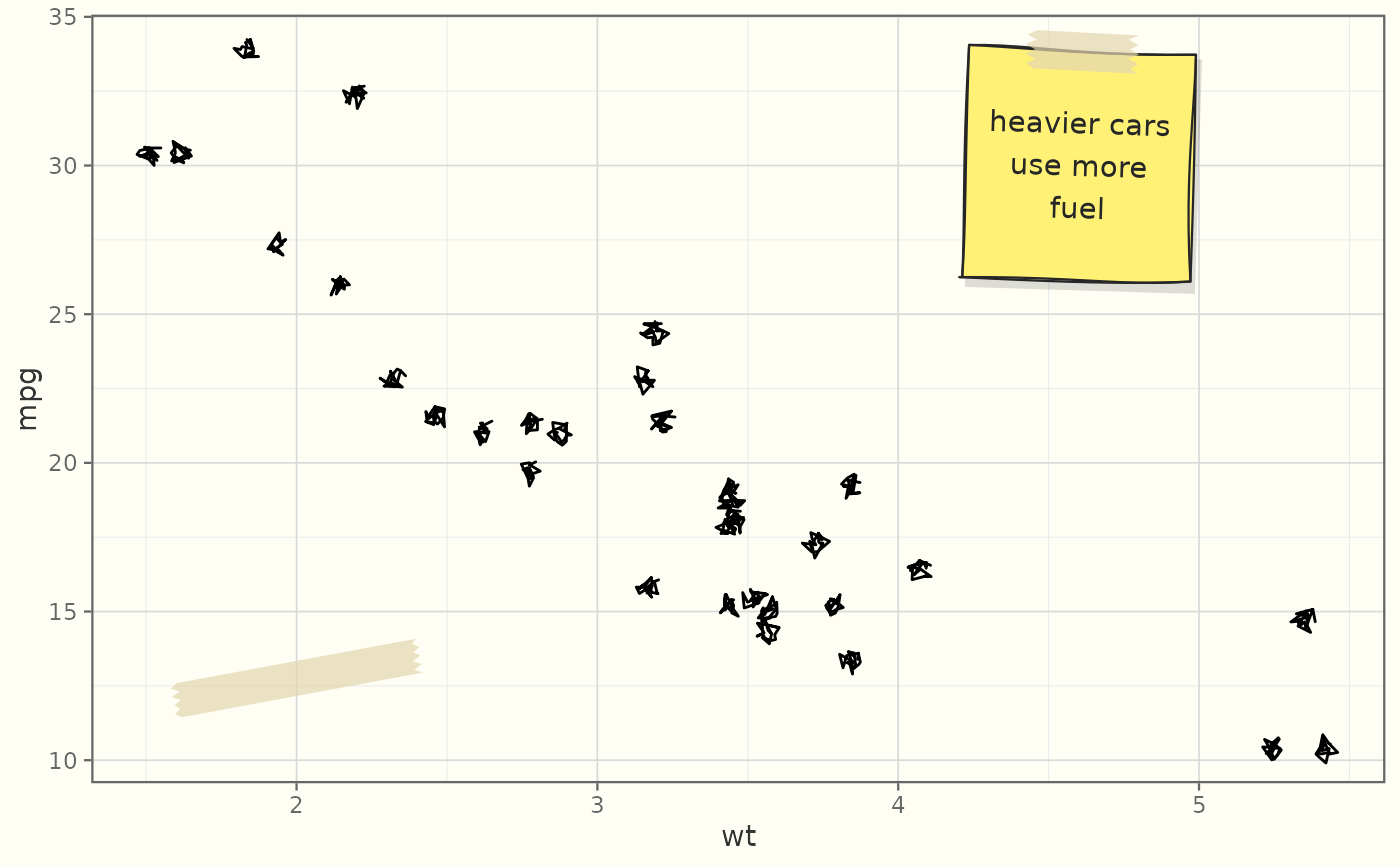
annotate_sketch_note()sticks a hand-drawn sticky note on the plot: a handwriting label on a tilted square of yellow paper with a strip of tape across its top. A thin wrapper aroundgeom_sketch_note()in the spirit ofggplot2::annotate()(constant positions,inherit.aes = FALSE).annotate_sketch_tape()lays a strip of translucent tape with torn ends from(x, y)to(xend, yend)– over a corner of an inset, a label or anything else that should look taped down.
Usage
annotate_sketch_note(x, y, label, seed = NULL, ...)

annotate_sketch_tape(
  x,
  y,
  xend,
  yend,
  width = 0.18,
  fill = "#E3D6AF",
  alpha = 0.7,
  seed = NULL,
  ...
)

GeomSketchTape
Arguments
- x, y
Note centre, or the tape's start, in data units. Vectors recycle.
- label
Label text;
"\n"breaks lines.- seed
Integer seed for the note's tilt and outline, or the tape's torn ends.
- ...
Other arguments passed on to
geom_sketch_note()(e.g.fill,colour,angle,size,tape,family) or to the tape layer.- xend, yend
The tape's end, in data units.
- width
The tape's width in inches. Default 0.18.
- fill, alpha
The tape's colour and opacity. Default a masking-tape beige at 0.7.
See also
Other sketch-geoms:
GeomSketchAbline,
GeomSketchArrow,
GeomSketchBoxplot,
GeomSketchBracket,
GeomSketchCallout,
GeomSketchChicklet,
GeomSketchCol,
GeomSketchContourFilled,
GeomSketchCurve,
GeomSketchDotplot,
GeomSketchDumbbell,
GeomSketchEdge,
GeomSketchEllipse,
GeomSketchEngrave,
GeomSketchGantt,
GeomSketchHex,
GeomSketchLine,
GeomSketchLinerange,
GeomSketchLollipop,
GeomSketchMarkCircle,
GeomSketchMarkHull,
GeomSketchNote,
GeomSketchPath,
GeomSketchPoint,
GeomSketchPolygon,
GeomSketchRect,
GeomSketchRibbon,
GeomSketchRug,
GeomSketchSegment,
GeomSketchSfPolygon,
GeomSketchSlope,
GeomSketchSmooth,
GeomSketchSpoke,
GeomSketchTextRepel,
GeomSketchViolin,
StatSketchBeeswarm,
StatSketchCalendar,
StatSketchDensityRidges,
StatSketchFunnel,
StatSketchPie,
StatSketchPyramid,
StatSketchRadar,
StatSketchStream,
StatSketchTreemap,
StatSketchWaffle,
StatSketchWaterfall,
annotate_sketch(),
annotate_sketch_arrow(),
annotate_sketch_callout(),
annotate_sketch_highlight(),
geom_sketch_alluvial(),
geom_sketch_arc_diagram(),
geom_sketch_bin2d(),
geom_sketch_bump(),
geom_sketch_chord(),
geom_sketch_contour(),
geom_sketch_count(),
geom_sketch_dendrogram(),
geom_sketch_density(),
geom_sketch_density2d(),
geom_sketch_ecdf(),
geom_sketch_function(),
geom_sketch_histogram(),
geom_sketch_jitter(),
geom_sketch_marimekko(),
geom_sketch_mosaic(),
geom_sketch_parallel(),
geom_sketch_point_interactive(),
geom_sketch_qq(),
geom_sketch_quantile(),
geom_sketch_rose(),
geom_sketch_sunburst(),
geom_sketch_text(),
sketch_graph()
Examples
library(ggplot2)
ggplot(mtcars, aes(wt, mpg)) +
  geom_sketch_point(seed = 1L) +
  annotate_sketch_note(x = 4.6, y = 30, label = "heavier cars\nuse more\nfuel",
                       seed = 2L) +
  annotate_sketch_tape(x = 1.6, y = 12, xend = 2.4, yend = 13.5, seed = 4L) +
  theme_sketch()