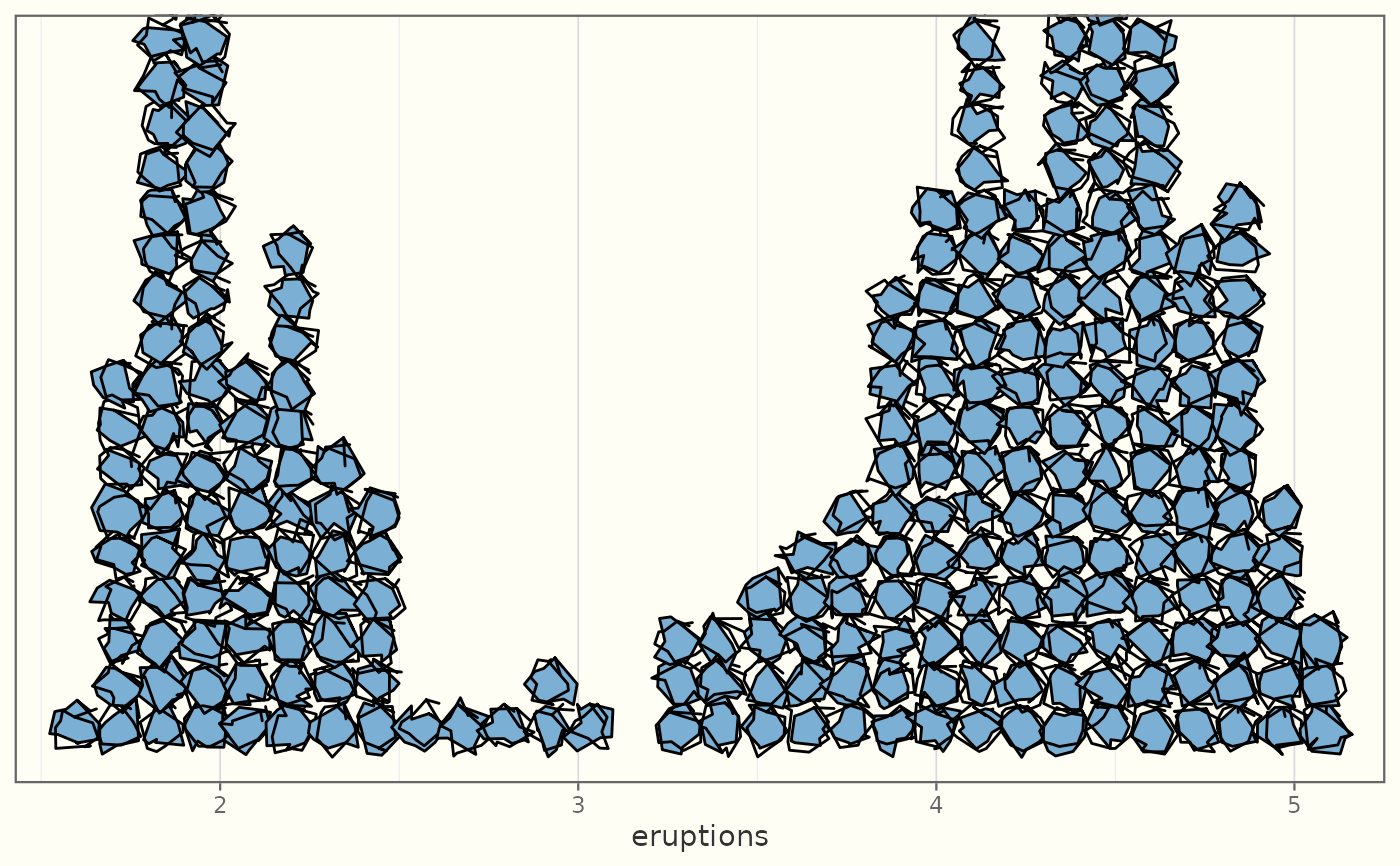
Draws a hand-drawn Wilkinson-style dot plot: the data are binned along x
into fixed-width bins, and one roughened circular dot per observation is
stacked upward in each bin. The sketch analogue of
ggplot2::geom_dotplot().
Usage
GeomSketchDotplot

geom_sketch_dotplot(
  mapping = NULL,
  data = NULL,
  stat = "identity",
  position = "identity",
  ...,
  binwidth = NULL,
  dotsize = 1,
  stackratio = 1,
  stackdir = "up",
  roughness = 0.6,
  bowing = 1,
  n_passes = 2L,
  seed = NULL,
  na.rm = FALSE,
  show.legend = NA,
  inherit.aes = TRUE
)
Arguments
- mapping
Aesthetic mappings created by
ggplot2::aes(). Requiresx.- data
Data to display.
- stat
Statistical transformation. Default
"identity".- position
Position adjustment. Default
"identity".- ...
Other arguments passed on to the layer.
- binwidth
Bin width in data units.
NULL(default) uses 1/30 of the data range.- dotsize
Dot diameter as a multiple of the bin width. Default 1.
- stackratio
Vertical spacing between stacked dots, as a fraction of the dot diameter. Default 1.
- stackdir
Stacking direction. Only
"up"is currently supported.- roughness
Non-negative dot roughness. Default 0.6.
- bowing
Non-negative bowing multiplier. Default 1.
- n_passes
Number of stroke passes. Default 2.
- seed
Integer seed.
NULLusesgetOption("ggsketch.seed", 1L).- na.rm
Remove missing values silently? Default
FALSE.- show.legend
Logical; include in legend?
- inherit.aes
Override default aesthetics?
Details
As in ggplot2::geom_dotplot(), the dots are sized by the bin width and the
y axis (the per-bin count) is only approximate; turn it off with
scale_y_continuous(NULL, breaks = NULL) for a clean look.
See also
Other sketch-geoms:
GeomSketchAbline,
GeomSketchArrow,
GeomSketchBoxplot,
GeomSketchBracket,
GeomSketchCallout,
GeomSketchChicklet,
GeomSketchCol,
GeomSketchContourFilled,
GeomSketchCurve,
GeomSketchDumbbell,
GeomSketchEdge,
GeomSketchEllipse,
GeomSketchEngrave,
GeomSketchGantt,
GeomSketchHex,
GeomSketchLine,
GeomSketchLinerange,
GeomSketchLollipop,
GeomSketchMarkCircle,
GeomSketchMarkHull,
GeomSketchPath,
GeomSketchPoint,
GeomSketchPolygon,
GeomSketchRect,
GeomSketchRibbon,
GeomSketchRug,
GeomSketchSegment,
GeomSketchSfPolygon,
GeomSketchSlope,
GeomSketchSmooth,
GeomSketchSpoke,
GeomSketchTextRepel,
GeomSketchViolin,
StatSketchBeeswarm,
StatSketchCalendar,
StatSketchDensityRidges,
StatSketchFunnel,
StatSketchPie,
StatSketchPyramid,
StatSketchRadar,
StatSketchStream,
StatSketchTreemap,
StatSketchWaffle,
StatSketchWaterfall,
annotate_sketch(),
annotate_sketch_arrow(),
annotate_sketch_callout(),
annotate_sketch_highlight(),
geom_sketch_alluvial(),
geom_sketch_arc_diagram(),
geom_sketch_bin2d(),
geom_sketch_bump(),
geom_sketch_chord(),
geom_sketch_contour(),
geom_sketch_count(),
geom_sketch_dendrogram(),
geom_sketch_density(),
geom_sketch_density2d(),
geom_sketch_ecdf(),
geom_sketch_function(),
geom_sketch_histogram(),
geom_sketch_jitter(),
geom_sketch_marimekko(),
geom_sketch_mosaic(),
geom_sketch_parallel(),
geom_sketch_qq(),
geom_sketch_quantile(),
geom_sketch_rose(),
geom_sketch_sunburst(),
geom_sketch_text(),
sketch_graph()
Examples
library(ggplot2)
ggplot(faithful, aes(eruptions)) +
  geom_sketch_dotplot(binwidth = 0.12, fill = "#7BAFD4", seed = 1L) +
  scale_y_continuous(NULL, breaks = NULL) +
  theme_sketch()