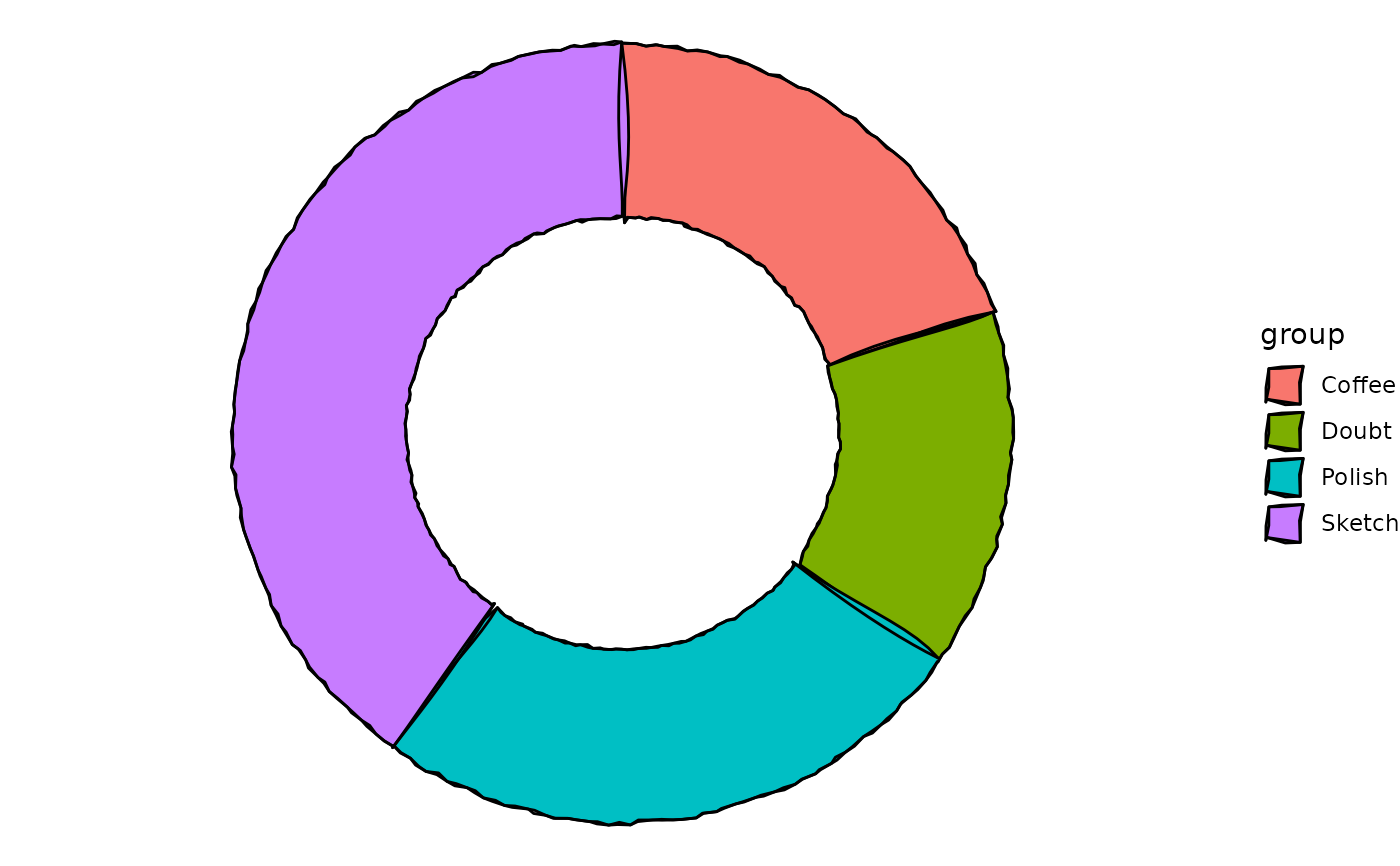
geom_sketch_pie() draws a hand-drawn pie chart: one slice per row, sized by
the amount aesthetic and coloured by fill. geom_sketch_donut() is the
same with a hole in the middle. Slices are kept circular regardless of the
panel's shape, so they look right without coord_fixed(). The chart is drawn
in the centre of the panel; pair it with theme_sketch() or
ggplot2::theme_void() to hide the (unused) axes.
Usage
GeomSketchPie

geom_sketch_pie(
  mapping = NULL,
  data = NULL,
  stat = StatSketchPie,
  position = "identity",
  ...,
  x0 = 0.5,
  y0 = 0.5,
  r = 0.45,
  r0 = 0,
  roughness = 1,
  bowing = 0.4,
  n_passes = 2L,
  seed = NULL,
  fill_style = "solid",
  hachure_angle = 45,
  hachure_gap = 0.02,
  fill_weight = 0.5,
  na.rm = FALSE,
  show.legend = NA,
  inherit.aes = TRUE
)

geom_sketch_donut(..., r0 = 0.25)
Arguments
- mapping
Aesthetic mappings created by
ggplot2::aes(). Requiresamount; mapfillto colour the slices.- data
Data with one row per slice.
- stat
The statistic; defaults to
StatSketchPie, which convertsamountinto slice angles.- position
Position adjustment. Default
"identity".- ...
Other arguments passed on to the layer.
- x0, y0
Pie centre in npc [0,1]. Default
0.5(panel centre).- r
Outer radius as a fraction of the smaller panel dimension. Default
0.45.- r0
Inner radius (hole) as a fraction of the smaller panel dimension.
0(default) is a full pie;geom_sketch_donut()defaults it to0.25(a ring betweenr0andr).- roughness
Non-negative roughness of the slice edges (0 = clean). Default 1.
- bowing
Non-negative bowing multiplier. Default 0.4 (kept low so the radial edges stay straight-ish).
- n_passes
Number of stroke passes. Default 2.
- seed
Integer seed.
NULLusesgetOption("ggsketch.seed", 1L).- fill_style
"solid"(default) paints each slice in itsfillcolour with a rough edge; any other style ("hachure","cross_hatch","zigzag","scribble","dots","dashed","stipple","pencil_shade") hatches it instead.- hachure_angle
Fill line angle in degrees. Default 45.
- hachure_gap
Spacing between fill lines, as a fraction of the smaller panel dimension – this is the hatch density knob: smaller is denser. Default 0.02.
- fill_weight
Stroke weight for fill lines. Default 0.5.
- na.rm
Remove missing values silently? Default
FALSE.- show.legend
Logical; include in legend?
- inherit.aes
Override default aesthetics?
See also
Other sketch-geoms:
GeomSketchAbline,
GeomSketchArrow,
GeomSketchBoxplot,
GeomSketchBracket,
GeomSketchCallout,
GeomSketchChicklet,
GeomSketchCol,
GeomSketchContourFilled,
GeomSketchCurve,
GeomSketchDotplot,
GeomSketchDumbbell,
GeomSketchEdge,
GeomSketchEllipse,
GeomSketchEngrave,
GeomSketchGantt,
GeomSketchHex,
GeomSketchLine,
GeomSketchLinerange,
GeomSketchLollipop,
GeomSketchMarkCircle,
GeomSketchMarkHull,
GeomSketchPath,
GeomSketchPoint,
GeomSketchPolygon,
GeomSketchRect,
GeomSketchRibbon,
GeomSketchRug,
GeomSketchSegment,
GeomSketchSfPolygon,
GeomSketchSlope,
GeomSketchSmooth,
GeomSketchSpoke,
GeomSketchTextRepel,
GeomSketchViolin,
StatSketchBeeswarm,
StatSketchCalendar,
StatSketchDensityRidges,
StatSketchFunnel,
StatSketchPyramid,
StatSketchRadar,
StatSketchStream,
StatSketchTreemap,
StatSketchWaffle,
StatSketchWaterfall,
annotate_sketch(),
annotate_sketch_arrow(),
annotate_sketch_callout(),
annotate_sketch_highlight(),
geom_sketch_alluvial(),
geom_sketch_arc_diagram(),
geom_sketch_bin2d(),
geom_sketch_bump(),
geom_sketch_chord(),
geom_sketch_contour(),
geom_sketch_count(),
geom_sketch_dendrogram(),
geom_sketch_density(),
geom_sketch_density2d(),
geom_sketch_ecdf(),
geom_sketch_function(),
geom_sketch_histogram(),
geom_sketch_jitter(),
geom_sketch_marimekko(),
geom_sketch_mosaic(),
geom_sketch_parallel(),
geom_sketch_qq(),
geom_sketch_quantile(),
geom_sketch_rose(),
geom_sketch_sunburst(),
geom_sketch_text(),
sketch_graph()
Examples
library(ggplot2)
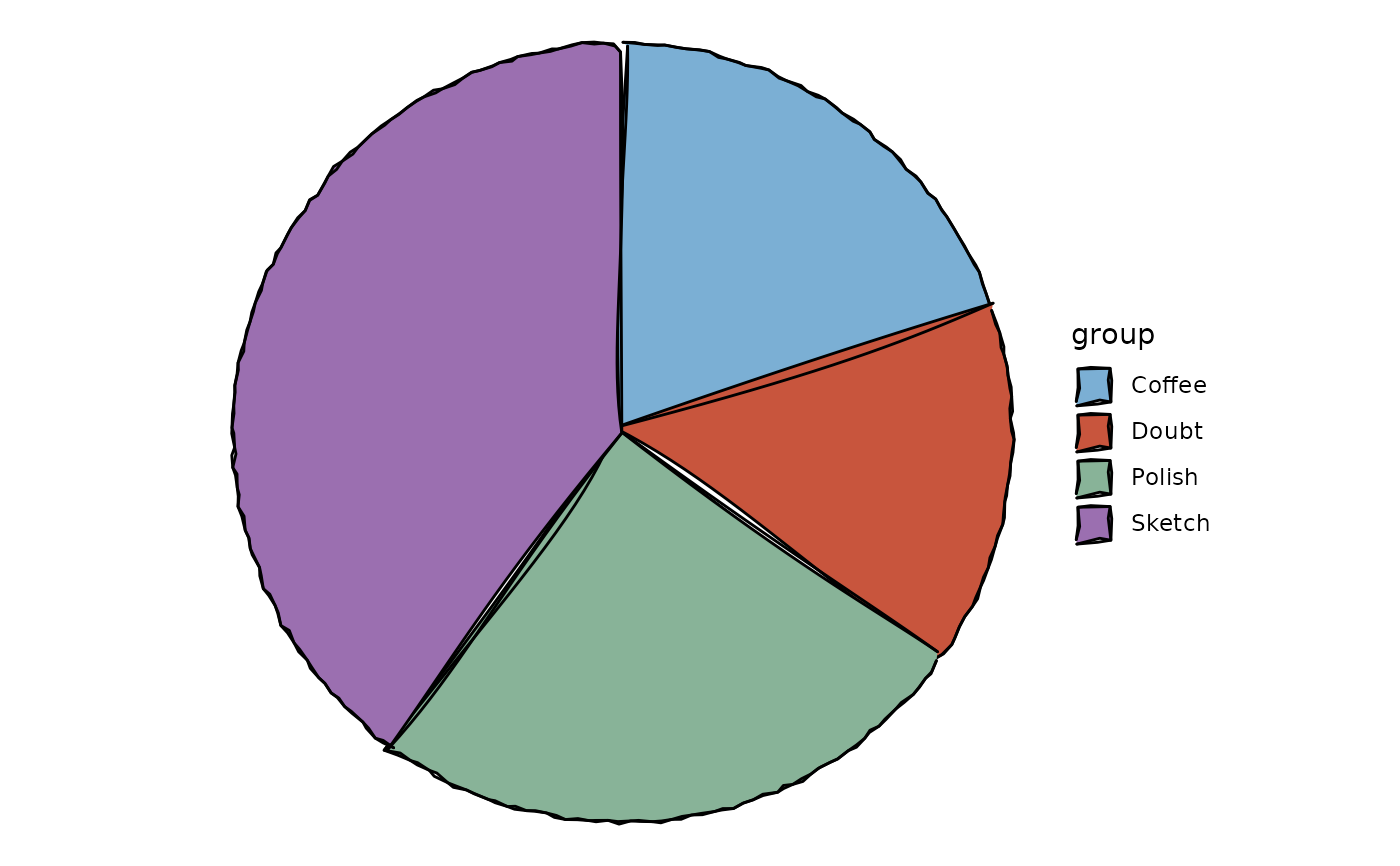
df <- data.frame(
group = c("Sketch", "Polish", "Coffee", "Doubt"),
amount = c(40, 25, 20, 15)
)
ggplot(df, aes(amount = amount, fill = group)) +
geom_sketch_pie(seed = 1L) +
scale_fill_sketch() +
coord_fixed() +
theme_void()
 # A donut:
ggplot(df, aes(amount = amount, fill = group)) +
geom_sketch_donut(seed = 2L) +
theme_void()
# A donut:
ggplot(df, aes(amount = amount, fill = group)) +
geom_sketch_donut(seed = 2L) +
theme_void()