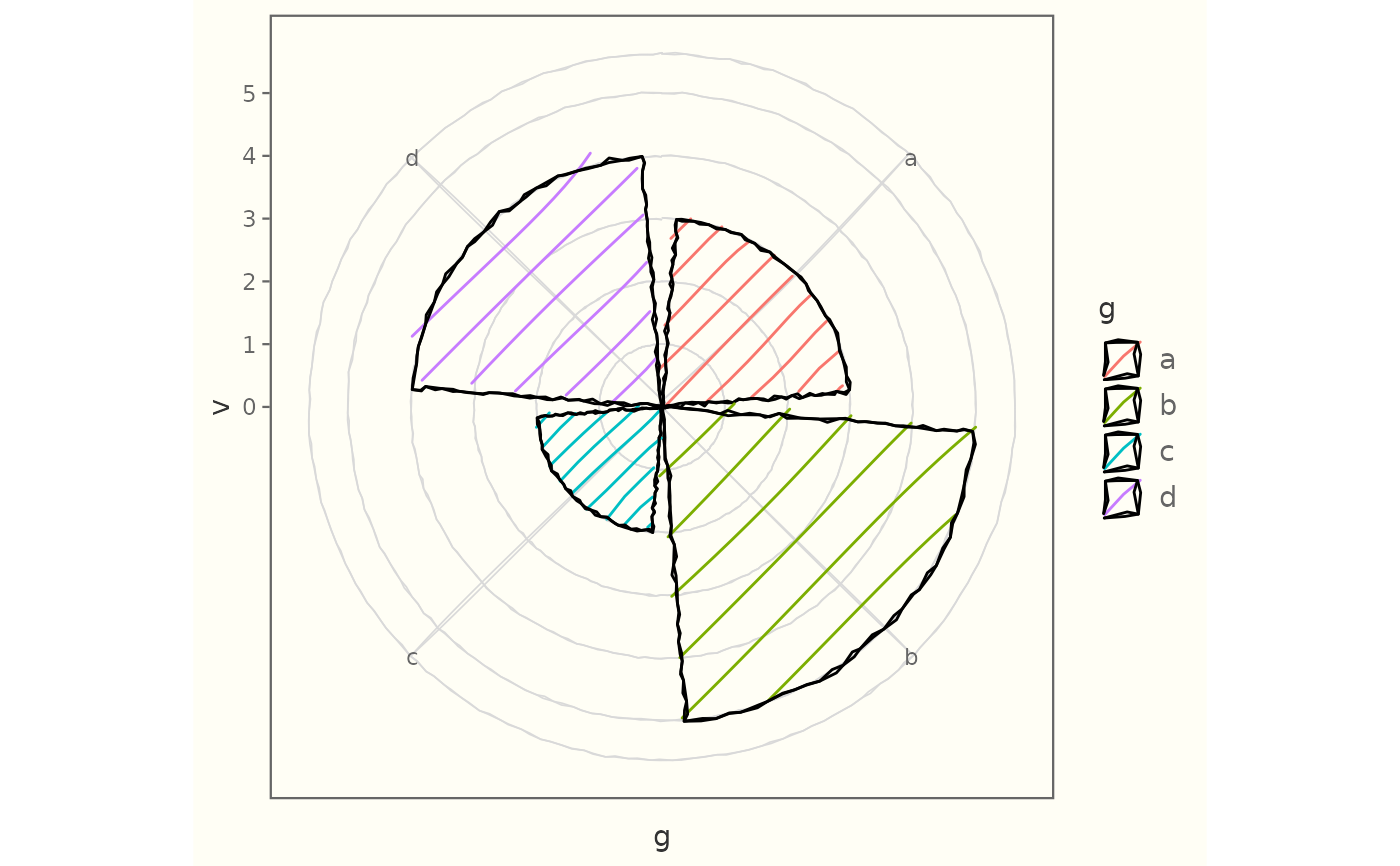
The polar companion to coord_sketch(): a drop-in replacement for
ggplot2::coord_polar() that draws the circular grid hand-drawn. The radial
and angular gridlines are rendered as roughened sketch grobs, so pie/rose
charts and circular bar plots get a frame that matches the marks – under any
theme. It reuses all of ggplot2's polar layout and only swaps how the grid is
drawn.
Usage
coord_sketch_polar(
  theta = "x",
  start = 0,
  direction = 1,
  clip = "on",
  roughness = 0.5,
  bowing = 0.5,
  n_passes = 2L,
  seed = NULL,
  rough_grid = TRUE
)
Arguments
- theta
Variable mapped to angle (
"x"or"y"). Default"x".- start
Offset of the starting point, in radians. Default 0.
- direction
1clockwise,-1anticlockwise. Default 1.- clip
Should drawing be clipped to the panel (
"on", default) or not ("off")?- roughness, bowing, n_passes
Sketch parameters for the grid. Gentle defaults suited to gridlines (
0.5,0.5,2).- seed
Integer seed for reproducible wobble.
NULLusesgetOption("ggsketch.seed", 1L).- rough_grid
Roughen the gridlines? Default
TRUE.
Examples
library(ggplot2)
df <- data.frame(g = c("a", "b", "c", "d"), v = c(3, 5, 2, 4))
# A hand-drawn circular bar (rose) chart:
ggplot(df, aes(g, v, fill = g)) +
  geom_sketch_col(seed = 1L) +
  coord_sketch_polar(seed = 1L) +
  theme_sketch()