Continuous scale for the sketch pressure aesthetic
Source: R/scale-pressure.R
scale_pressure_continuous.Rdgeom_sketch_line() and geom_sketch_path() let you map a variable to
pressure (aes(pressure = z)) so the stroke swells and thins along the
line, like a real pen pressed harder in places. This scale rescales that
variable's observed range to a band of width multipliers, just as
scale_size() rescales to a size range. It is applied automatically whenever
pressure is mapped to a continuous variable, so you only call it directly to
change range. To use values as raw width multipliers with no rescaling, wrap
them in base::I() (aes(pressure = I(z))).
Arguments
- ...
Other arguments passed to
ggplot2::continuous_scale().- range
Output width-multiplier range. Default
c(0.2, 1.6): the lightest pressure draws the stroke at0.2xits base width, the heaviest at1.6x.- guide
Legend guide. Defaults to
"none"because the legend keys do not reflect pressure; set to"legend"to show one anyway.
Details
Mapping pressure renders the line through the variable-width
stroke_ribbon() engine even under the default medium = "pen", and combines
with a non-pen medium (the medium's own width profile is multiplied by the
mapped pressure).
Examples
library(ggplot2)
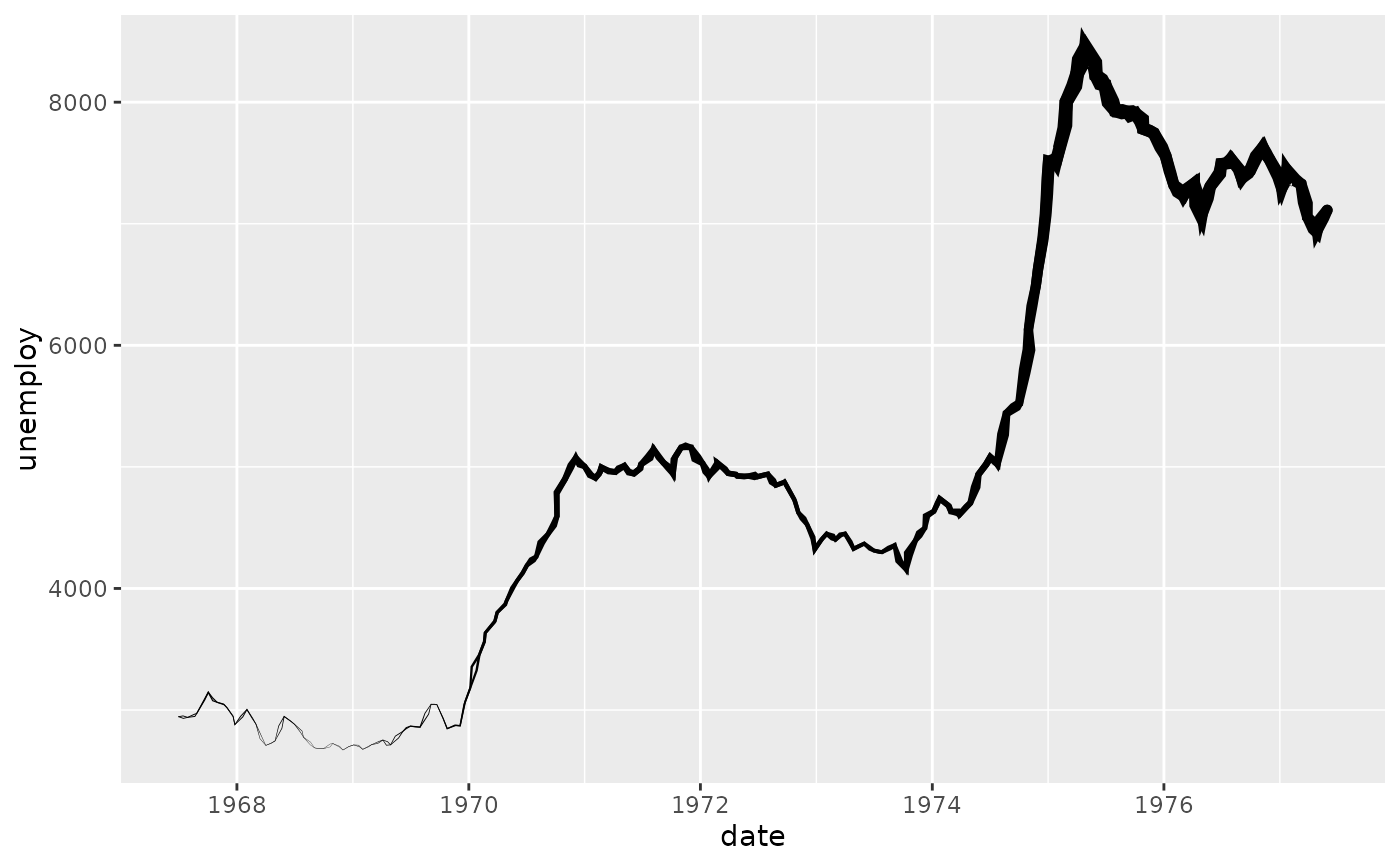
# A line whose width tracks a variable, rescaled to c(0.2, 1.6) automatically.
ggplot(economics[1:120, ], aes(date, unemploy, pressure = unemploy)) +
geom_sketch_line(linewidth = 1, seed = 1L)
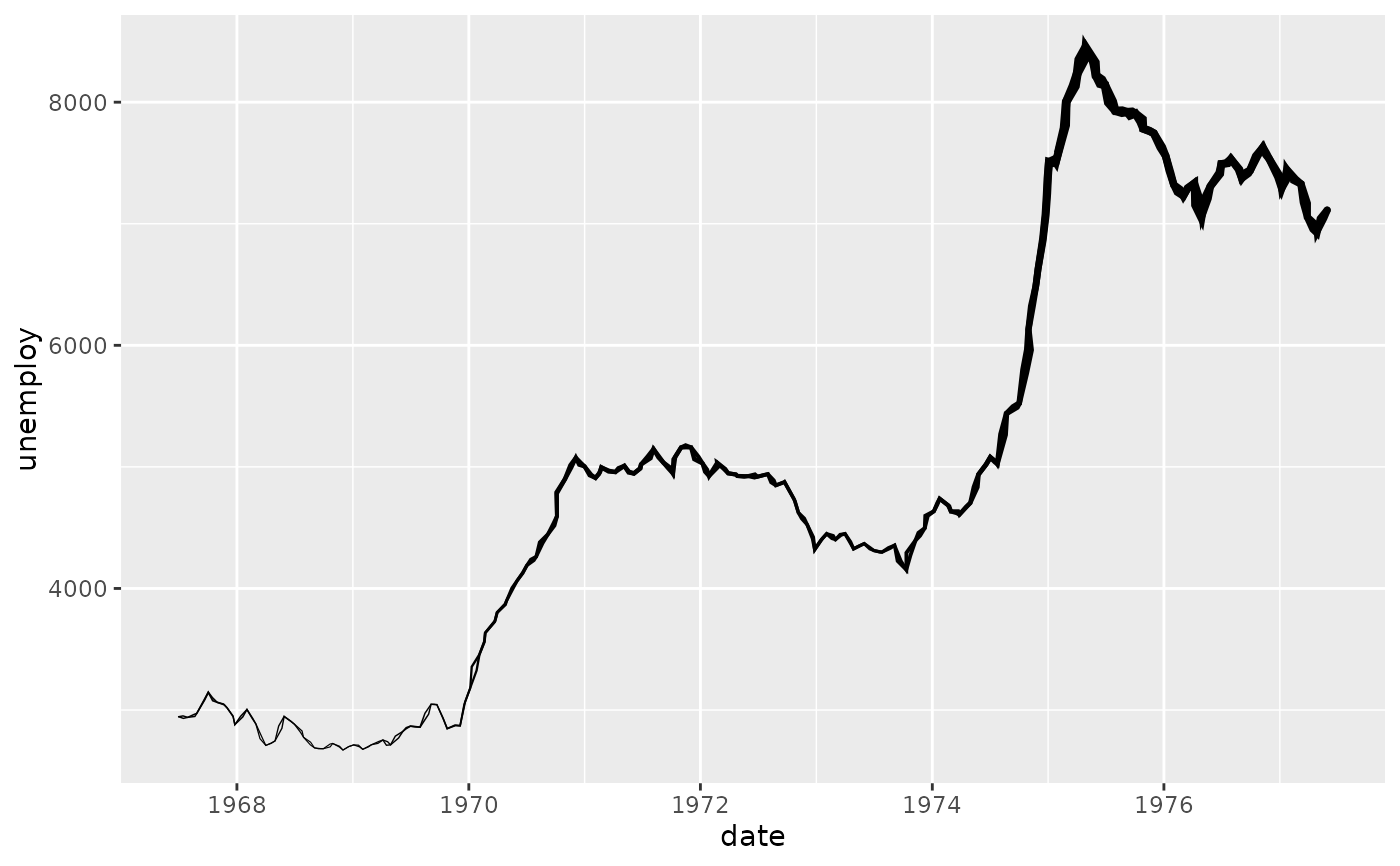 # Widen the band for a more dramatic swell.
ggplot(economics[1:120, ], aes(date, unemploy, pressure = unemploy)) +
geom_sketch_line(linewidth = 1, seed = 1L) +
scale_pressure_continuous(range = c(0.05, 2.5))
# Widen the band for a more dramatic swell.
ggplot(economics[1:120, ], aes(date, unemploy, pressure = unemploy)) +
geom_sketch_line(linewidth = 1, seed = 1L) +
scale_pressure_continuous(range = c(0.05, 2.5))