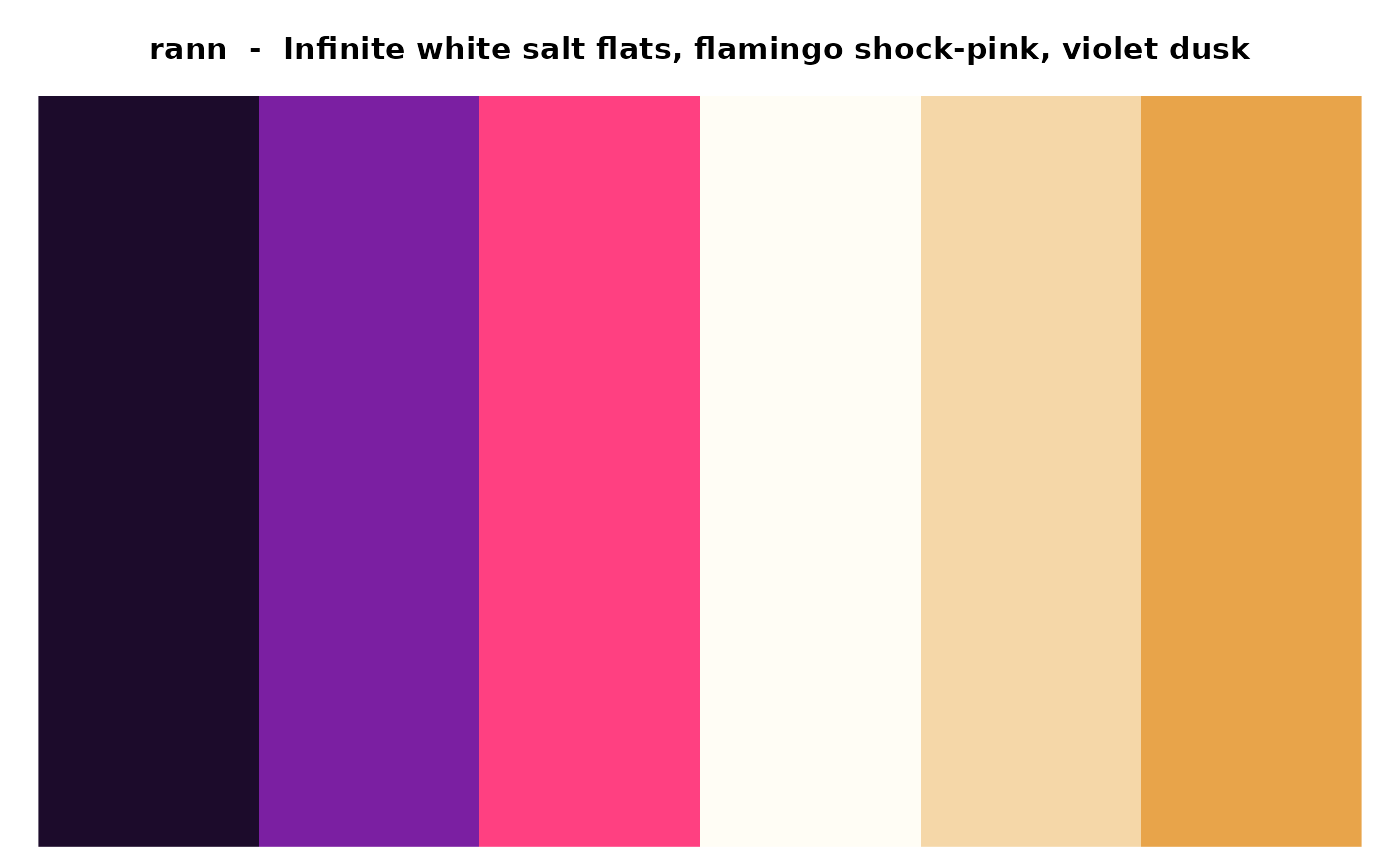
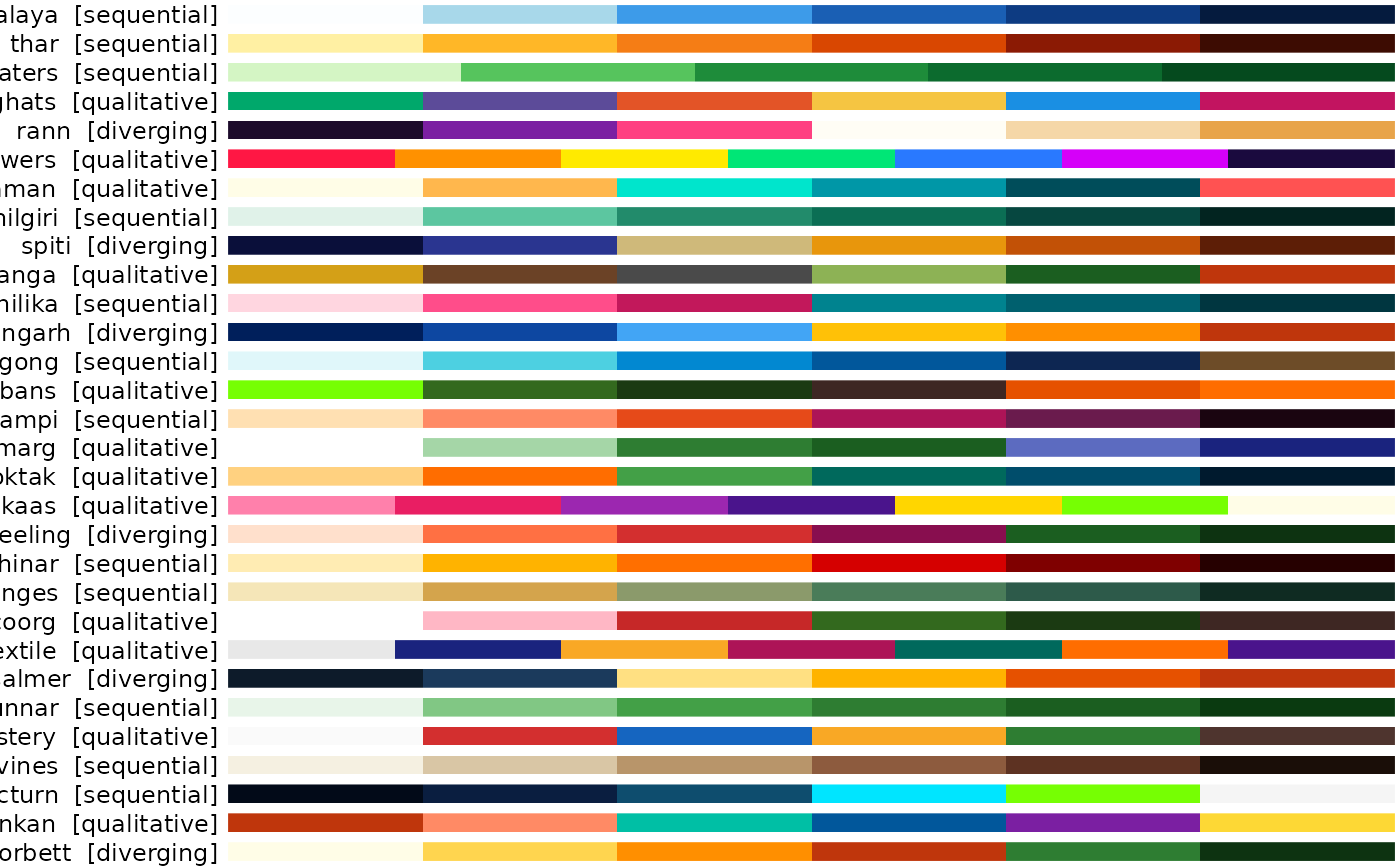
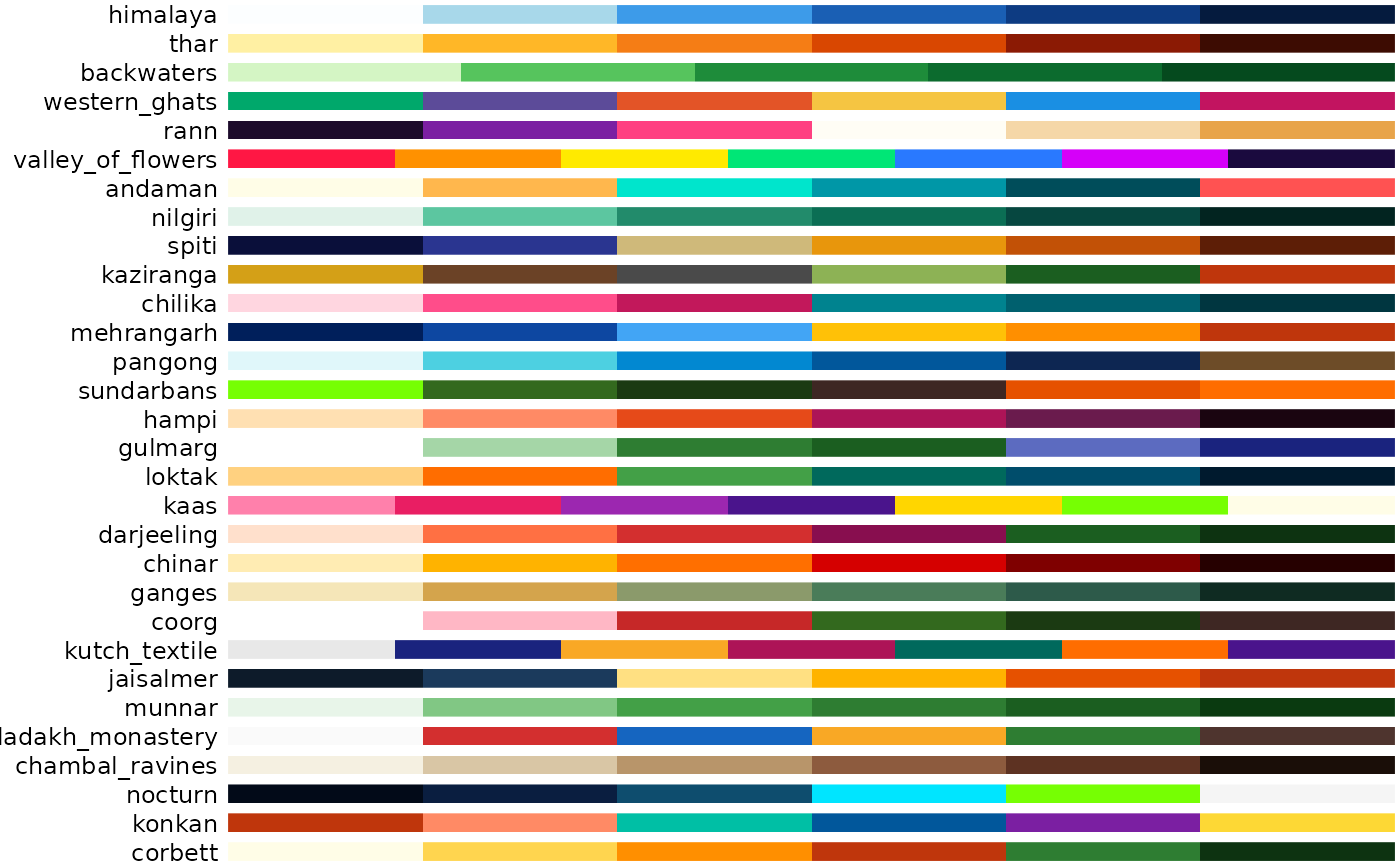
Renders a base-graphics swatch view of one palette, or a stacked grid of all palettes. Useful for quick visual inspection in the R console / RStudio Plots pane.
Arguments
- name
Character or
NULL. Name of the palette. IfNULL(default), displays all 30 palettes stacked vertically.- show_type
Logical. If
TRUE(default), includes the palette type (sequential, diverging, qualitative) in row labels. Must beTRUEorFALSE- to filter by type, useprakriti_info()instead.